Malaysian vs Canadian Disability Age Under 5
COMPARE
Malaysian
Canadian
Disability Age Under 5
Disability Age Under 5 Comparison
Malaysians
Canadians
1.3%
DISABILITY AGE UNDER 5
13.2/ 100
METRIC RATING
218th/ 347
METRIC RANK
1.5%
DISABILITY AGE UNDER 5
0.0/ 100
METRIC RATING
277th/ 347
METRIC RANK
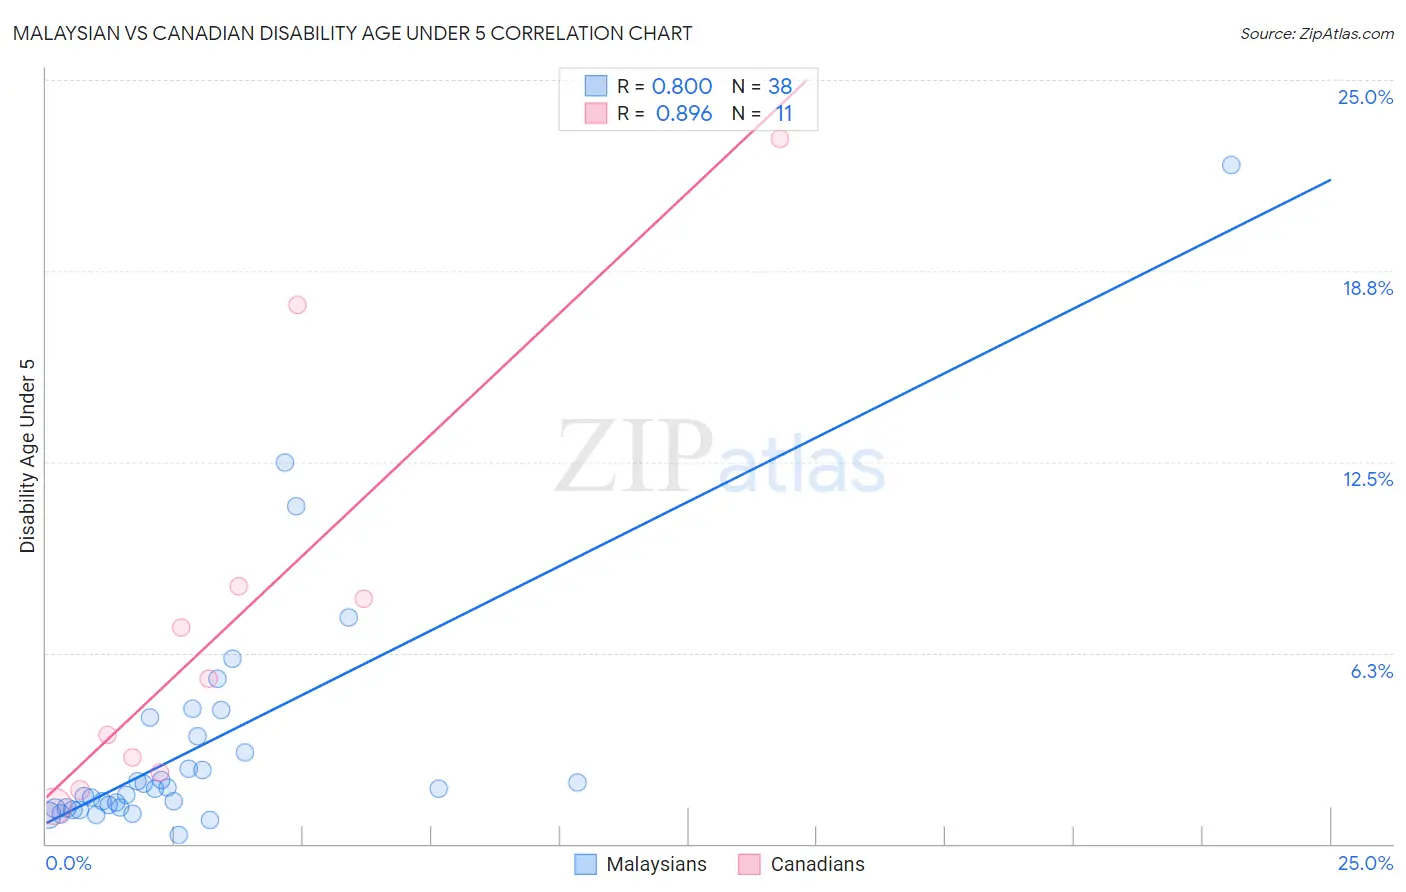
Malaysian vs Canadian Disability Age Under 5 Correlation Chart
The statistical analysis conducted on geographies consisting of 149,792,432 people shows a strong positive correlation between the proportion of Malaysians and percentage of population with a disability under the age of 5 in the United States with a correlation coefficient (R) of 0.800 and weighted average of 1.3%. Similarly, the statistical analysis conducted on geographies consisting of 226,239,251 people shows a very strong positive correlation between the proportion of Canadians and percentage of population with a disability under the age of 5 in the United States with a correlation coefficient (R) of 0.896 and weighted average of 1.5%, a difference of 14.1%.
Disability Age Under 5 Correlation Summary
| Measurement | Malaysian | Canadian |
| Minimum | 0.28% | 1.2% |
| Maximum | 22.2% | 23.1% |
| Range | 21.9% | 21.8% |
| Mean | 3.2% | 7.4% |
| Median | 1.8% | 5.4% |
| Interquartile 25% (IQ1) | 1.2% | 2.3% |
| Interquartile 75% (IQ3) | 3.5% | 8.4% |
| Interquartile Range (IQR) | 2.3% | 6.1% |
| Standard Deviation (Sample) | 4.1% | 7.0% |
| Standard Deviation (Population) | 4.1% | 6.7% |
Similar Demographics by Disability Age Under 5
Demographics Similar to Malaysians by Disability Age Under 5
In terms of disability age under 5, the demographic groups most similar to Malaysians are Cypriot (1.3%, a difference of 0.31%), Immigrants from Croatia (1.3%, a difference of 0.40%), Bangladeshi (1.3%, a difference of 0.41%), Syrian (1.3%, a difference of 0.51%), and Immigrants from Chile (1.3%, a difference of 0.68%).
| Demographics | Rating | Rank | Disability Age Under 5 |
| Immigrants | Greece | 19.1 /100 | #211 | Poor 1.3% |
| Chileans | 18.8 /100 | #212 | Poor 1.3% |
| Immigrants | Sudan | 18.7 /100 | #213 | Poor 1.3% |
| Immigrants | Chile | 17.2 /100 | #214 | Poor 1.3% |
| Syrians | 16.1 /100 | #215 | Poor 1.3% |
| Bangladeshis | 15.5 /100 | #216 | Poor 1.3% |
| Cypriots | 14.9 /100 | #217 | Poor 1.3% |
| Malaysians | 13.2 /100 | #218 | Poor 1.3% |
| Immigrants | Croatia | 11.2 /100 | #219 | Poor 1.3% |
| Serbians | 9.6 /100 | #220 | Tragic 1.3% |
| Sub-Saharan Africans | 8.3 /100 | #221 | Tragic 1.3% |
| Ukrainians | 8.3 /100 | #222 | Tragic 1.3% |
| Hispanics or Latinos | 7.7 /100 | #223 | Tragic 1.3% |
| Latvians | 7.1 /100 | #224 | Tragic 1.3% |
| Panamanians | 7.1 /100 | #225 | Tragic 1.3% |
Demographics Similar to Canadians by Disability Age Under 5
In terms of disability age under 5, the demographic groups most similar to Canadians are Kiowa (1.5%, a difference of 0.080%), Danish (1.5%, a difference of 0.090%), Greek (1.5%, a difference of 0.70%), British (1.5%, a difference of 0.85%), and Brazilian (1.5%, a difference of 1.3%).
| Demographics | Rating | Rank | Disability Age Under 5 |
| Immigrants | North America | 0.1 /100 | #270 | Tragic 1.4% |
| Immigrants | Canada | 0.1 /100 | #271 | Tragic 1.4% |
| Blacks/African Americans | 0.1 /100 | #272 | Tragic 1.4% |
| Alaskan Athabascans | 0.1 /100 | #273 | Tragic 1.5% |
| Iroquois | 0.0 /100 | #274 | Tragic 1.5% |
| Brazilians | 0.0 /100 | #275 | Tragic 1.5% |
| Greeks | 0.0 /100 | #276 | Tragic 1.5% |
| Canadians | 0.0 /100 | #277 | Tragic 1.5% |
| Kiowa | 0.0 /100 | #278 | Tragic 1.5% |
| Danes | 0.0 /100 | #279 | Tragic 1.5% |
| British | 0.0 /100 | #280 | Tragic 1.5% |
| Czechoslovakians | 0.0 /100 | #281 | Tragic 1.5% |
| Cheyenne | 0.0 /100 | #282 | Tragic 1.5% |
| Delaware | 0.0 /100 | #283 | Tragic 1.5% |
| Europeans | 0.0 /100 | #284 | Tragic 1.5% |