Macedonian vs Greek Nursery School
COMPARE
Macedonian
Greek
Nursery School
Nursery School Comparison
Macedonians
Greeks
98.3%
NURSERY SCHOOL
98.7/ 100
METRIC RATING
92nd/ 347
METRIC RANK
98.4%
NURSERY SCHOOL
99.7/ 100
METRIC RATING
64th/ 347
METRIC RANK
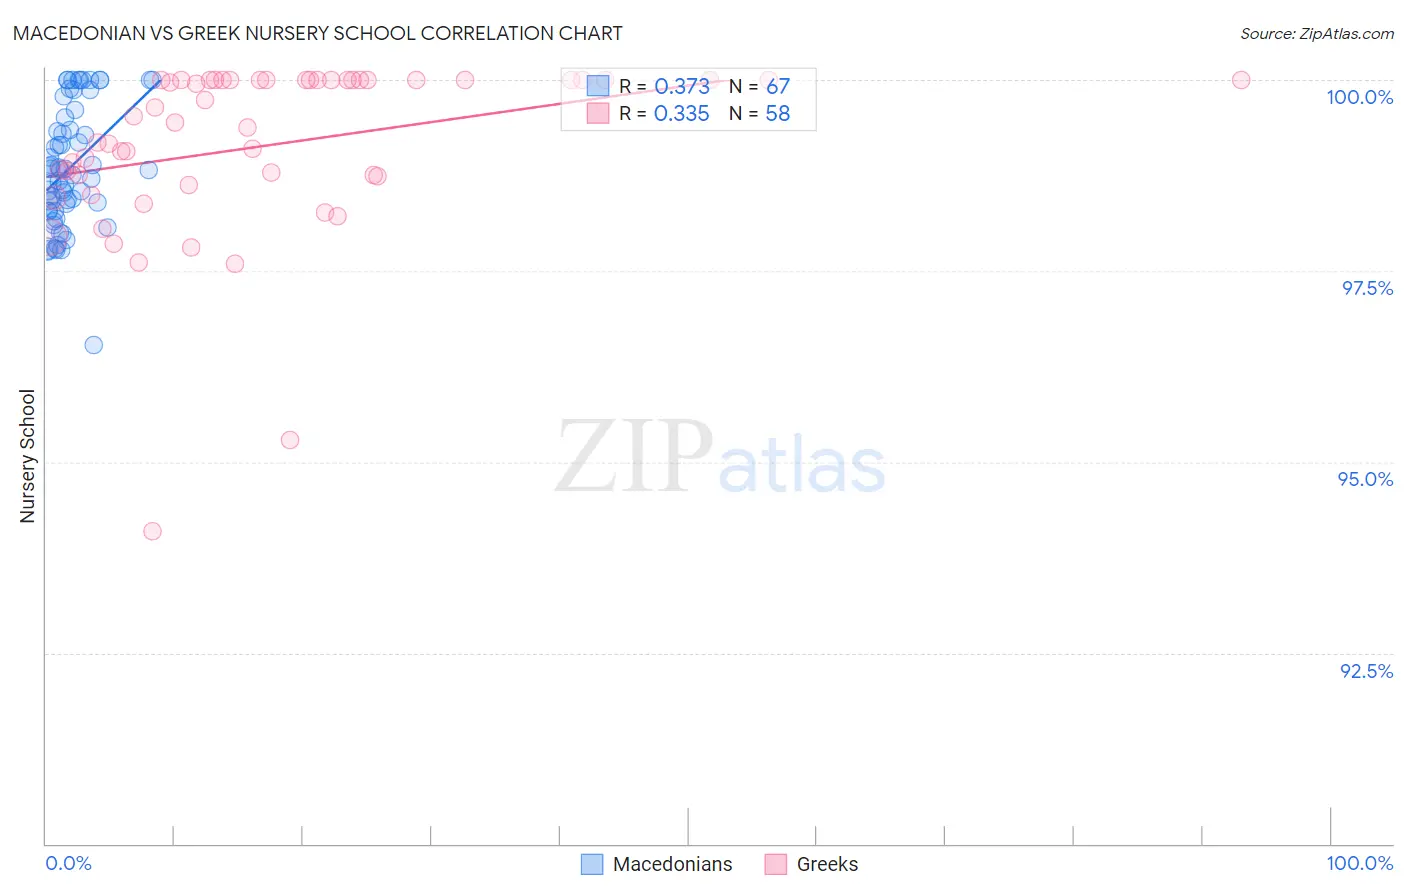
Macedonian vs Greek Nursery School Correlation Chart
The statistical analysis conducted on geographies consisting of 132,590,497 people shows a mild positive correlation between the proportion of Macedonians and percentage of population with at least nursery school education in the United States with a correlation coefficient (R) of 0.373 and weighted average of 98.3%. Similarly, the statistical analysis conducted on geographies consisting of 482,775,358 people shows a mild positive correlation between the proportion of Greeks and percentage of population with at least nursery school education in the United States with a correlation coefficient (R) of 0.335 and weighted average of 98.4%, a difference of 0.12%.
Nursery School Correlation Summary
| Measurement | Macedonian | Greek |
| Minimum | 96.5% | 94.1% |
| Maximum | 100.0% | 100.0% |
| Range | 3.5% | 5.9% |
| Mean | 98.9% | 99.1% |
| Median | 98.8% | 99.5% |
| Interquartile 25% (IQ1) | 98.3% | 98.7% |
| Interquartile 75% (IQ3) | 99.5% | 100.0% |
| Interquartile Range (IQR) | 1.2% | 1.3% |
| Standard Deviation (Sample) | 0.78% | 1.1% |
| Standard Deviation (Population) | 0.77% | 1.1% |
Similar Demographics by Nursery School
Demographics Similar to Macedonians by Nursery School
In terms of nursery school, the demographic groups most similar to Macedonians are Immigrants from Western Europe (98.3%, a difference of 0.0%), Zimbabwean (98.3%, a difference of 0.0%), Immigrants from India (98.3%, a difference of 0.0%), Hopi (98.3%, a difference of 0.010%), and Ukrainian (98.3%, a difference of 0.010%).
| Demographics | Rating | Rank | Nursery School |
| Immigrants | Sweden | 99.1 /100 | #85 | Exceptional 98.3% |
| Immigrants | Australia | 99.0 /100 | #86 | Exceptional 98.3% |
| Hopi | 98.9 /100 | #87 | Exceptional 98.3% |
| Ukrainians | 98.9 /100 | #88 | Exceptional 98.3% |
| Immigrants | South Africa | 98.8 /100 | #89 | Exceptional 98.3% |
| Immigrants | Western Europe | 98.8 /100 | #90 | Exceptional 98.3% |
| Zimbabweans | 98.8 /100 | #91 | Exceptional 98.3% |
| Macedonians | 98.7 /100 | #92 | Exceptional 98.3% |
| Immigrants | India | 98.7 /100 | #93 | Exceptional 98.3% |
| Immigrants | Germany | 98.6 /100 | #94 | Exceptional 98.3% |
| South Africans | 98.6 /100 | #95 | Exceptional 98.3% |
| Cypriots | 98.3 /100 | #96 | Exceptional 98.3% |
| Immigrants | Nonimmigrants | 98.3 /100 | #97 | Exceptional 98.3% |
| Choctaw | 98.3 /100 | #98 | Exceptional 98.3% |
| Colville | 98.2 /100 | #99 | Exceptional 98.3% |
Demographics Similar to Greeks by Nursery School
In terms of nursery school, the demographic groups most similar to Greeks are New Zealander (98.4%, a difference of 0.0%), Creek (98.4%, a difference of 0.0%), Immigrants from North America (98.4%, a difference of 0.0%), Maltese (98.4%, a difference of 0.0%), and Austrian (98.4%, a difference of 0.010%).
| Demographics | Rating | Rank | Nursery School |
| Austrians | 99.8 /100 | #57 | Exceptional 98.4% |
| Bulgarians | 99.8 /100 | #58 | Exceptional 98.4% |
| Immigrants | Canada | 99.8 /100 | #59 | Exceptional 98.4% |
| Slavs | 99.8 /100 | #60 | Exceptional 98.4% |
| New Zealanders | 99.7 /100 | #61 | Exceptional 98.4% |
| Creek | 99.7 /100 | #62 | Exceptional 98.4% |
| Immigrants | North America | 99.7 /100 | #63 | Exceptional 98.4% |
| Greeks | 99.7 /100 | #64 | Exceptional 98.4% |
| Maltese | 99.7 /100 | #65 | Exceptional 98.4% |
| Canadians | 99.7 /100 | #66 | Exceptional 98.4% |
| Immigrants | Northern Europe | 99.6 /100 | #67 | Exceptional 98.4% |
| Russians | 99.6 /100 | #68 | Exceptional 98.4% |
| Immigrants | Austria | 99.6 /100 | #69 | Exceptional 98.4% |
| Cheyenne | 99.6 /100 | #70 | Exceptional 98.4% |
| Serbians | 99.6 /100 | #71 | Exceptional 98.4% |