Mexican American Indian vs Greek Male Disability
COMPARE
Mexican American Indian
Greek
Male Disability
Male Disability Comparison
Mexican American Indians
Greeks
11.6%
MALE DISABILITY
7.8/ 100
METRIC RATING
213th/ 347
METRIC RANK
11.4%
MALE DISABILITY
22.2/ 100
METRIC RATING
193rd/ 347
METRIC RANK
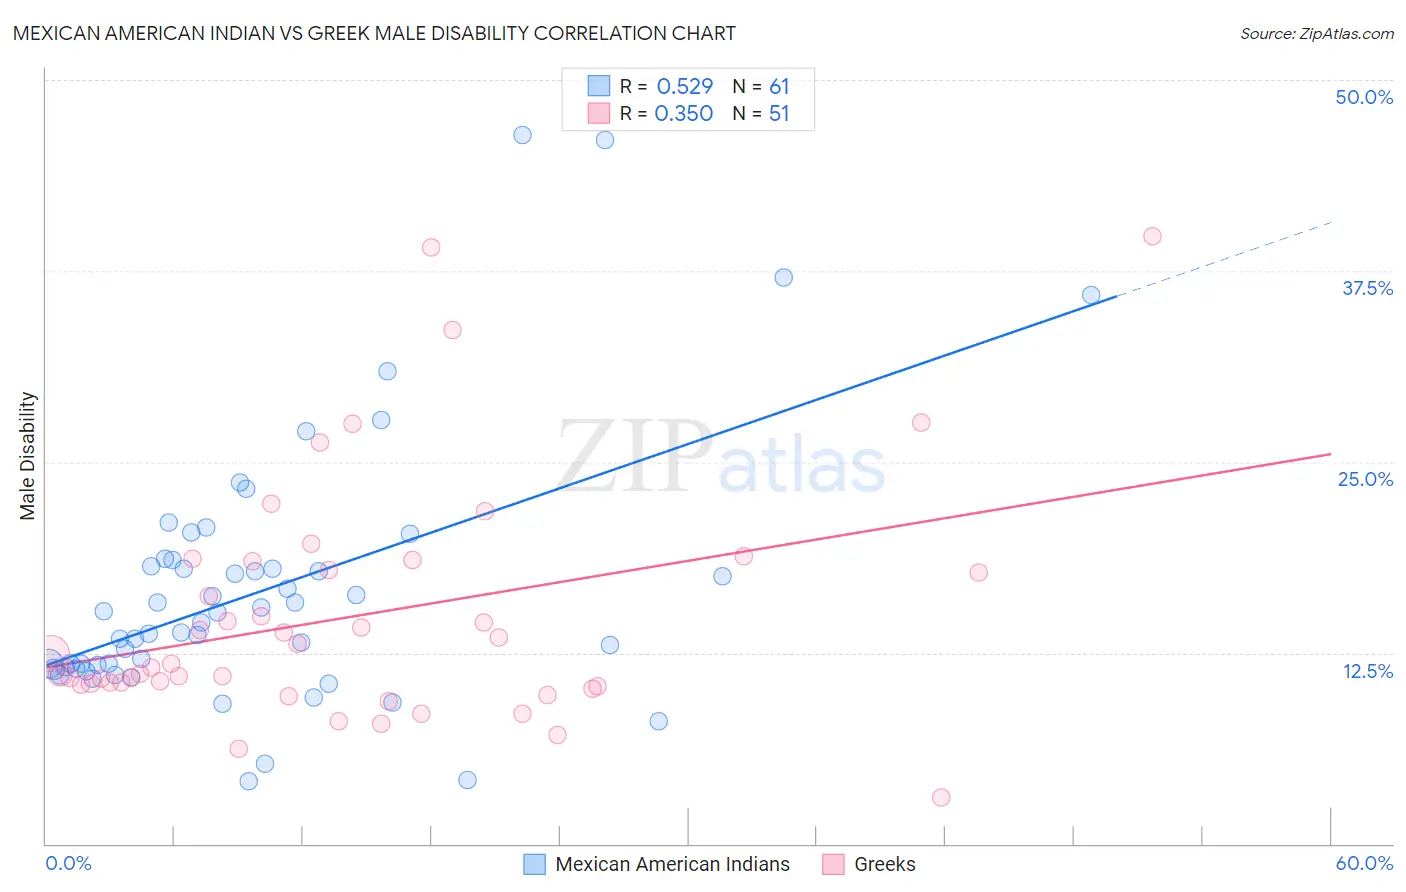
Mexican American Indian vs Greek Male Disability Correlation Chart
The statistical analysis conducted on geographies consisting of 317,563,584 people shows a substantial positive correlation between the proportion of Mexican American Indians and percentage of males with a disability in the United States with a correlation coefficient (R) of 0.529 and weighted average of 11.6%. Similarly, the statistical analysis conducted on geographies consisting of 482,664,692 people shows a mild positive correlation between the proportion of Greeks and percentage of males with a disability in the United States with a correlation coefficient (R) of 0.350 and weighted average of 11.4%, a difference of 1.7%.
Male Disability Correlation Summary
| Measurement | Mexican American Indian | Greek |
| Minimum | 4.1% | 3.0% |
| Maximum | 46.4% | 39.7% |
| Range | 42.3% | 36.7% |
| Mean | 16.6% | 14.9% |
| Median | 14.5% | 11.8% |
| Interquartile 25% (IQ1) | 11.5% | 10.4% |
| Interquartile 75% (IQ3) | 18.4% | 18.5% |
| Interquartile Range (IQR) | 6.8% | 8.1% |
| Standard Deviation (Sample) | 8.5% | 7.8% |
| Standard Deviation (Population) | 8.4% | 7.7% |
Demographics Similar to Mexican American Indians and Greeks by Male Disability
In terms of male disability, the demographic groups most similar to Mexican American Indians are Immigrants from Scotland (11.6%, a difference of 0.080%), Immigrants from Thailand (11.6%, a difference of 0.10%), Ute (11.6%, a difference of 0.28%), Spanish American Indian (11.6%, a difference of 0.37%), and Icelander (11.6%, a difference of 0.39%). Similarly, the demographic groups most similar to Greeks are Belizean (11.4%, a difference of 0.080%), Immigrants from Oceania (11.4%, a difference of 0.11%), West Indian (11.4%, a difference of 0.33%), Somali (11.4%, a difference of 0.34%), and Immigrants from Jamaica (11.5%, a difference of 0.52%).
| Demographics | Rating | Rank | Male Disability |
| Greeks | 22.2 /100 | #193 | Fair 11.4% |
| Belizeans | 21.2 /100 | #194 | Fair 11.4% |
| Immigrants | Oceania | 20.9 /100 | #195 | Fair 11.4% |
| West Indians | 18.4 /100 | #196 | Poor 11.4% |
| Somalis | 18.2 /100 | #197 | Poor 11.4% |
| Immigrants | Jamaica | 16.3 /100 | #198 | Poor 11.5% |
| Lebanese | 15.4 /100 | #199 | Poor 11.5% |
| Immigrants | Iraq | 13.0 /100 | #200 | Poor 11.5% |
| Immigrants | Panama | 13.0 /100 | #201 | Poor 11.5% |
| Immigrants | Mexico | 12.6 /100 | #202 | Poor 11.5% |
| Jamaicans | 10.9 /100 | #203 | Poor 11.5% |
| Immigrants | Cambodia | 10.8 /100 | #204 | Poor 11.5% |
| Serbians | 10.7 /100 | #205 | Poor 11.5% |
| Ukrainians | 10.6 /100 | #206 | Poor 11.5% |
| Immigrants | Somalia | 10.4 /100 | #207 | Poor 11.5% |
| Icelanders | 10.1 /100 | #208 | Poor 11.6% |
| Spanish American Indians | 10.1 /100 | #209 | Poor 11.6% |
| Ute | 9.4 /100 | #210 | Tragic 11.6% |
| Immigrants | Thailand | 8.4 /100 | #211 | Tragic 11.6% |
| Immigrants | Scotland | 8.2 /100 | #212 | Tragic 11.6% |
| Mexican American Indians | 7.8 /100 | #213 | Tragic 11.6% |