Immigrants from Ecuador vs Greek Male Disability
COMPARE
Immigrants from Ecuador
Greek
Male Disability
Male Disability Comparison
Immigrants from Ecuador
Greeks
10.4%
MALE DISABILITY
99.3/ 100
METRIC RATING
62nd/ 347
METRIC RANK
11.4%
MALE DISABILITY
22.2/ 100
METRIC RATING
193rd/ 347
METRIC RANK
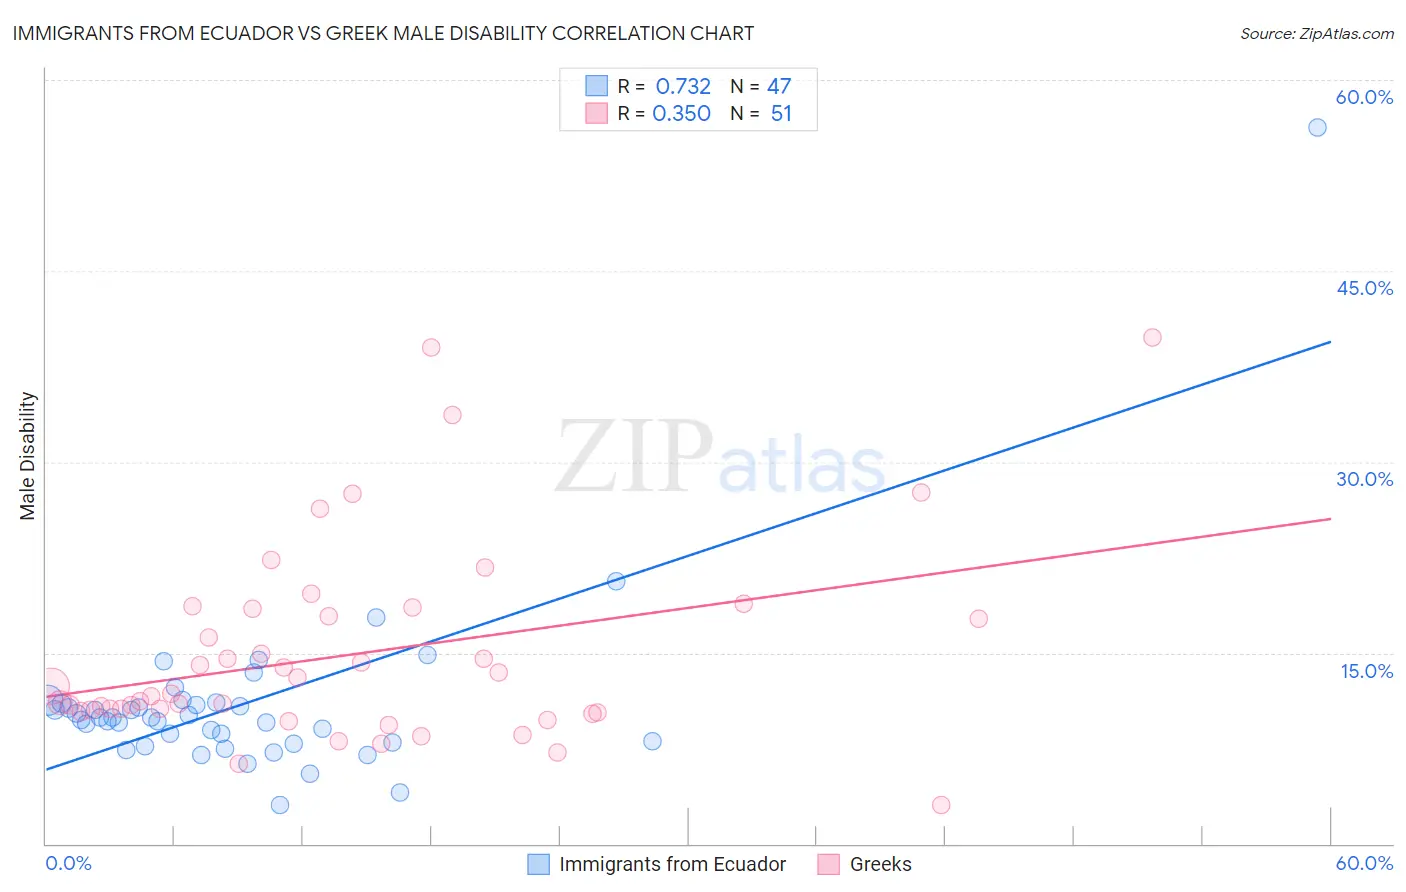
Immigrants from Ecuador vs Greek Male Disability Correlation Chart
The statistical analysis conducted on geographies consisting of 270,973,645 people shows a strong positive correlation between the proportion of Immigrants from Ecuador and percentage of males with a disability in the United States with a correlation coefficient (R) of 0.732 and weighted average of 10.4%. Similarly, the statistical analysis conducted on geographies consisting of 482,664,692 people shows a mild positive correlation between the proportion of Greeks and percentage of males with a disability in the United States with a correlation coefficient (R) of 0.350 and weighted average of 11.4%, a difference of 9.3%.
Male Disability Correlation Summary
| Measurement | Immigrants from Ecuador | Greek |
| Minimum | 3.0% | 3.0% |
| Maximum | 56.2% | 39.7% |
| Range | 53.3% | 36.7% |
| Mean | 10.9% | 14.9% |
| Median | 9.9% | 11.8% |
| Interquartile 25% (IQ1) | 8.0% | 10.4% |
| Interquartile 75% (IQ3) | 11.0% | 18.5% |
| Interquartile Range (IQR) | 3.1% | 8.1% |
| Standard Deviation (Sample) | 7.4% | 7.8% |
| Standard Deviation (Population) | 7.4% | 7.7% |
Similar Demographics by Male Disability
Demographics Similar to Immigrants from Ecuador by Male Disability
In terms of male disability, the demographic groups most similar to Immigrants from Ecuador are Immigrants from Belarus (10.4%, a difference of 0.020%), Jordanian (10.5%, a difference of 0.15%), Immigrants from Grenada (10.5%, a difference of 0.17%), Guyanese (10.5%, a difference of 0.17%), and Immigrants from Afghanistan (10.5%, a difference of 0.18%).
| Demographics | Rating | Rank | Male Disability |
| Immigrants | Eritrea | 99.6 /100 | #55 | Exceptional 10.4% |
| Tongans | 99.6 /100 | #56 | Exceptional 10.4% |
| Immigrants | South America | 99.6 /100 | #57 | Exceptional 10.4% |
| Immigrants | Japan | 99.5 /100 | #58 | Exceptional 10.4% |
| Immigrants | Australia | 99.5 /100 | #59 | Exceptional 10.4% |
| Immigrants | Colombia | 99.5 /100 | #60 | Exceptional 10.4% |
| Immigrants | Northern Africa | 99.4 /100 | #61 | Exceptional 10.4% |
| Immigrants | Ecuador | 99.3 /100 | #62 | Exceptional 10.4% |
| Immigrants | Belarus | 99.3 /100 | #63 | Exceptional 10.4% |
| Jordanians | 99.3 /100 | #64 | Exceptional 10.5% |
| Immigrants | Grenada | 99.2 /100 | #65 | Exceptional 10.5% |
| Guyanese | 99.2 /100 | #66 | Exceptional 10.5% |
| Immigrants | Afghanistan | 99.2 /100 | #67 | Exceptional 10.5% |
| Colombians | 99.2 /100 | #68 | Exceptional 10.5% |
| Ecuadorians | 99.2 /100 | #69 | Exceptional 10.5% |
Demographics Similar to Greeks by Male Disability
In terms of male disability, the demographic groups most similar to Greeks are Assyrian/Chaldean/Syriac (11.4%, a difference of 0.070%), Senegalese (11.4%, a difference of 0.080%), Belizean (11.4%, a difference of 0.080%), Immigrants from Oceania (11.4%, a difference of 0.11%), and Immigrants from Bosnia and Herzegovina (11.4%, a difference of 0.24%).
| Demographics | Rating | Rank | Male Disability |
| Immigrants | Zaire | 27.6 /100 | #186 | Fair 11.4% |
| Immigrants | Austria | 27.3 /100 | #187 | Fair 11.4% |
| Estonians | 26.8 /100 | #188 | Fair 11.4% |
| Immigrants | Netherlands | 25.9 /100 | #189 | Fair 11.4% |
| Immigrants | Bosnia and Herzegovina | 25.4 /100 | #190 | Fair 11.4% |
| Senegalese | 23.2 /100 | #191 | Fair 11.4% |
| Assyrians/Chaldeans/Syriacs | 23.2 /100 | #192 | Fair 11.4% |
| Greeks | 22.2 /100 | #193 | Fair 11.4% |
| Belizeans | 21.2 /100 | #194 | Fair 11.4% |
| Immigrants | Oceania | 20.9 /100 | #195 | Fair 11.4% |
| West Indians | 18.4 /100 | #196 | Poor 11.4% |
| Somalis | 18.2 /100 | #197 | Poor 11.4% |
| Immigrants | Jamaica | 16.3 /100 | #198 | Poor 11.5% |
| Lebanese | 15.4 /100 | #199 | Poor 11.5% |
| Immigrants | Iraq | 13.0 /100 | #200 | Poor 11.5% |