Luxembourger vs South American Vision Disability
COMPARE
Luxembourger
South American
Vision Disability
Vision Disability Comparison
Luxembourgers
South Americans
1.9%
VISION DISABILITY
99.9/ 100
METRIC RATING
32nd/ 347
METRIC RANK
2.1%
VISION DISABILITY
82.8/ 100
METRIC RATING
142nd/ 347
METRIC RANK
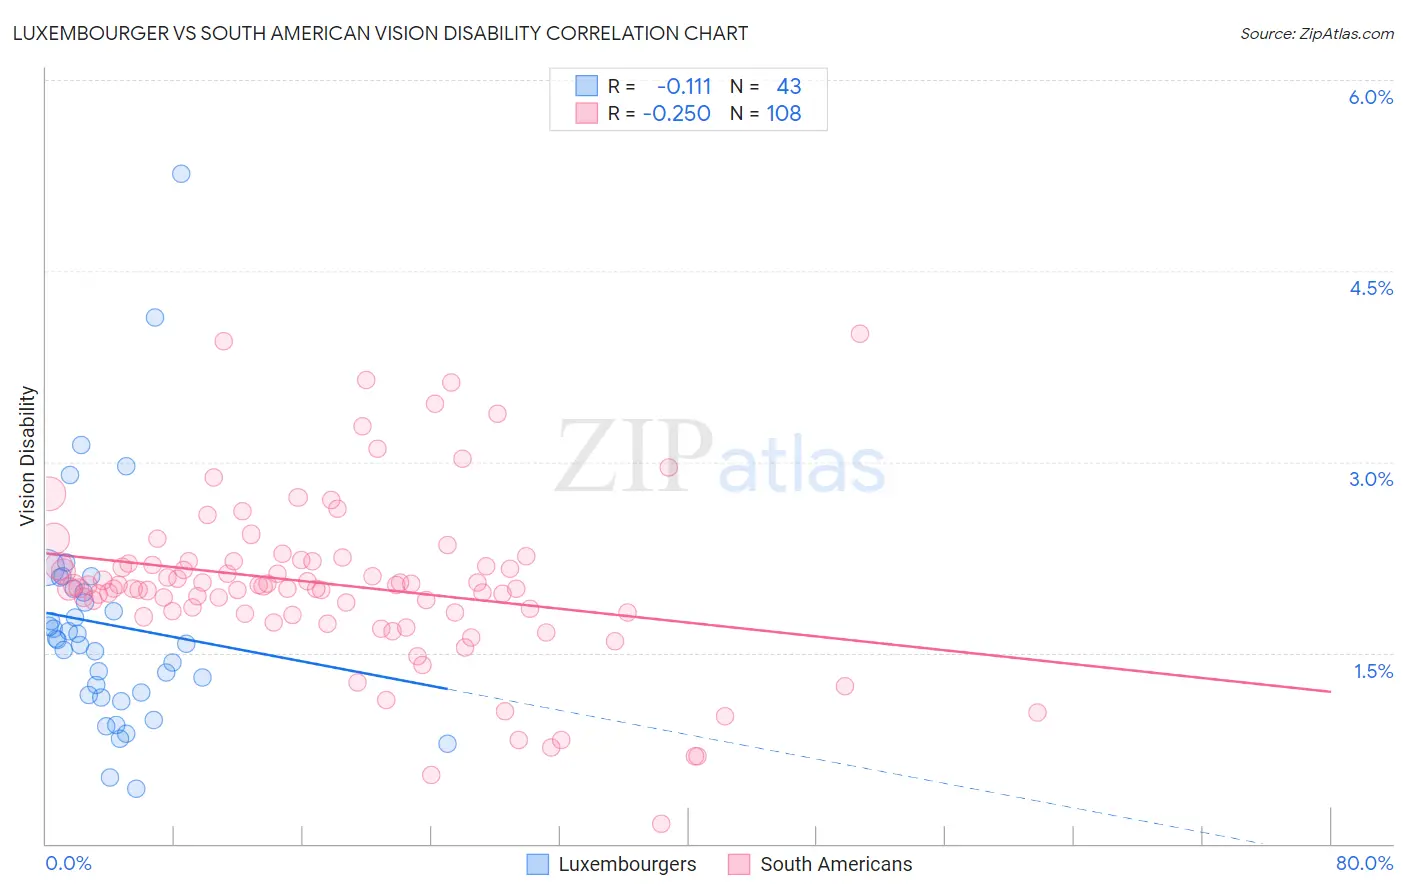
Luxembourger vs South American Vision Disability Correlation Chart
The statistical analysis conducted on geographies consisting of 144,652,316 people shows a poor negative correlation between the proportion of Luxembourgers and percentage of population with vision disability in the United States with a correlation coefficient (R) of -0.111 and weighted average of 1.9%. Similarly, the statistical analysis conducted on geographies consisting of 493,362,805 people shows a weak negative correlation between the proportion of South Americans and percentage of population with vision disability in the United States with a correlation coefficient (R) of -0.250 and weighted average of 2.1%, a difference of 9.0%.
Vision Disability Correlation Summary
| Measurement | Luxembourger | South American |
| Minimum | 0.43% | 0.16% |
| Maximum | 5.3% | 4.0% |
| Range | 4.8% | 3.9% |
| Mean | 1.7% | 2.0% |
| Median | 1.6% | 2.0% |
| Interquartile 25% (IQ1) | 1.2% | 1.8% |
| Interquartile 75% (IQ3) | 2.0% | 2.2% |
| Interquartile Range (IQR) | 0.84% | 0.40% |
| Standard Deviation (Sample) | 0.90% | 0.66% |
| Standard Deviation (Population) | 0.89% | 0.66% |
Similar Demographics by Vision Disability
Demographics Similar to Luxembourgers by Vision Disability
In terms of vision disability, the demographic groups most similar to Luxembourgers are Mongolian (1.9%, a difference of 0.27%), Immigrants from Egypt (1.9%, a difference of 0.31%), Immigrants from Nepal (1.9%, a difference of 0.43%), Immigrants from Turkey (1.9%, a difference of 0.43%), and Egyptian (1.9%, a difference of 0.47%).
| Demographics | Rating | Rank | Vision Disability |
| Bulgarians | 99.9 /100 | #25 | Exceptional 1.9% |
| Immigrants | Japan | 99.9 /100 | #26 | Exceptional 1.9% |
| Taiwanese | 99.9 /100 | #27 | Exceptional 1.9% |
| Immigrants | Malaysia | 99.9 /100 | #28 | Exceptional 1.9% |
| Egyptians | 99.9 /100 | #29 | Exceptional 1.9% |
| Immigrants | Nepal | 99.9 /100 | #30 | Exceptional 1.9% |
| Mongolians | 99.9 /100 | #31 | Exceptional 1.9% |
| Luxembourgers | 99.9 /100 | #32 | Exceptional 1.9% |
| Immigrants | Egypt | 99.9 /100 | #33 | Exceptional 1.9% |
| Immigrants | Turkey | 99.8 /100 | #34 | Exceptional 1.9% |
| Immigrants | Australia | 99.8 /100 | #35 | Exceptional 1.9% |
| Cambodians | 99.8 /100 | #36 | Exceptional 2.0% |
| Bhutanese | 99.8 /100 | #37 | Exceptional 2.0% |
| Immigrants | Kuwait | 99.8 /100 | #38 | Exceptional 2.0% |
| Zimbabweans | 99.7 /100 | #39 | Exceptional 2.0% |
Demographics Similar to South Americans by Vision Disability
In terms of vision disability, the demographic groups most similar to South Americans are Immigrants from Sierra Leone (2.1%, a difference of 0.0%), Ukrainian (2.1%, a difference of 0.11%), Sierra Leonean (2.1%, a difference of 0.15%), Immigrants from Bosnia and Herzegovina (2.1%, a difference of 0.15%), and Immigrants from Netherlands (2.1%, a difference of 0.16%).
| Demographics | Rating | Rank | Vision Disability |
| Vietnamese | 86.7 /100 | #135 | Excellent 2.1% |
| Czechs | 86.3 /100 | #136 | Excellent 2.1% |
| Immigrants | South Eastern Asia | 86.3 /100 | #137 | Excellent 2.1% |
| Arabs | 86.3 /100 | #138 | Excellent 2.1% |
| Immigrants | Morocco | 85.2 /100 | #139 | Excellent 2.1% |
| Immigrants | Netherlands | 84.2 /100 | #140 | Excellent 2.1% |
| Sierra Leoneans | 84.1 /100 | #141 | Excellent 2.1% |
| South Americans | 82.8 /100 | #142 | Excellent 2.1% |
| Immigrants | Sierra Leone | 82.8 /100 | #143 | Excellent 2.1% |
| Ukrainians | 81.9 /100 | #144 | Excellent 2.1% |
| Immigrants | Bosnia and Herzegovina | 81.5 /100 | #145 | Excellent 2.1% |
| Italians | 79.7 /100 | #146 | Good 2.1% |
| Immigrants | Sudan | 78.4 /100 | #147 | Good 2.1% |
| Finns | 78.3 /100 | #148 | Good 2.1% |
| Colombians | 76.2 /100 | #149 | Good 2.1% |