Luxembourger vs Jamaican Vision Disability
COMPARE
Luxembourger
Jamaican
Vision Disability
Vision Disability Comparison
Luxembourgers
Jamaicans
1.9%
VISION DISABILITY
99.9/ 100
METRIC RATING
32nd/ 347
METRIC RANK
2.4%
VISION DISABILITY
0.1/ 100
METRIC RATING
262nd/ 347
METRIC RANK
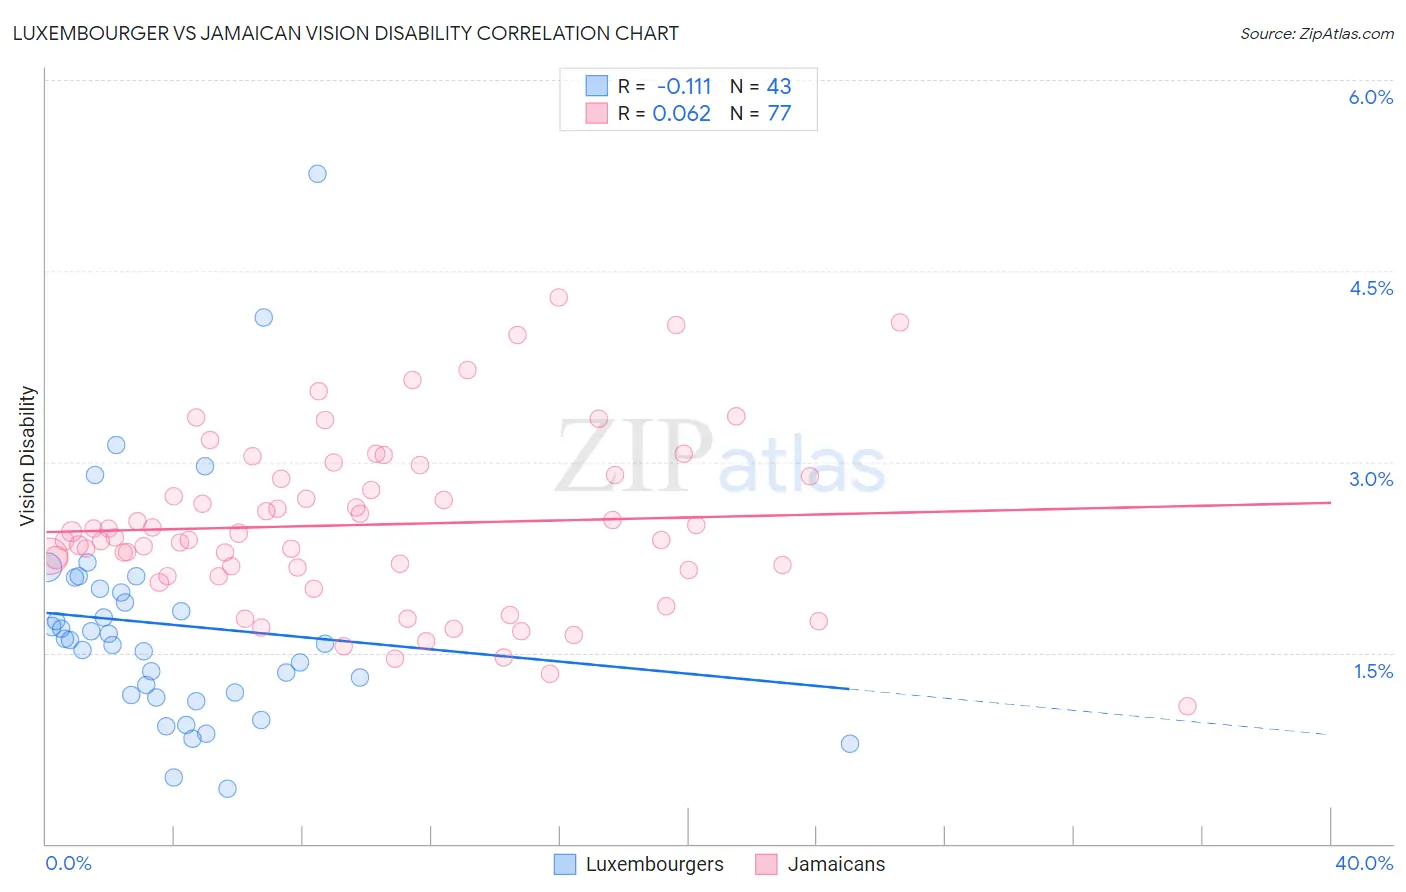
Luxembourger vs Jamaican Vision Disability Correlation Chart
The statistical analysis conducted on geographies consisting of 144,652,316 people shows a poor negative correlation between the proportion of Luxembourgers and percentage of population with vision disability in the United States with a correlation coefficient (R) of -0.111 and weighted average of 1.9%. Similarly, the statistical analysis conducted on geographies consisting of 367,713,681 people shows a slight positive correlation between the proportion of Jamaicans and percentage of population with vision disability in the United States with a correlation coefficient (R) of 0.062 and weighted average of 2.4%, a difference of 23.2%.
Vision Disability Correlation Summary
| Measurement | Luxembourger | Jamaican |
| Minimum | 0.43% | 1.1% |
| Maximum | 5.3% | 4.3% |
| Range | 4.8% | 3.2% |
| Mean | 1.7% | 2.5% |
| Median | 1.6% | 2.4% |
| Interquartile 25% (IQ1) | 1.2% | 2.1% |
| Interquartile 75% (IQ3) | 2.0% | 2.9% |
| Interquartile Range (IQR) | 0.84% | 0.76% |
| Standard Deviation (Sample) | 0.90% | 0.67% |
| Standard Deviation (Population) | 0.89% | 0.67% |
Similar Demographics by Vision Disability
Demographics Similar to Luxembourgers by Vision Disability
In terms of vision disability, the demographic groups most similar to Luxembourgers are Mongolian (1.9%, a difference of 0.27%), Immigrants from Egypt (1.9%, a difference of 0.31%), Immigrants from Nepal (1.9%, a difference of 0.43%), Immigrants from Turkey (1.9%, a difference of 0.43%), and Egyptian (1.9%, a difference of 0.47%).
| Demographics | Rating | Rank | Vision Disability |
| Bulgarians | 99.9 /100 | #25 | Exceptional 1.9% |
| Immigrants | Japan | 99.9 /100 | #26 | Exceptional 1.9% |
| Taiwanese | 99.9 /100 | #27 | Exceptional 1.9% |
| Immigrants | Malaysia | 99.9 /100 | #28 | Exceptional 1.9% |
| Egyptians | 99.9 /100 | #29 | Exceptional 1.9% |
| Immigrants | Nepal | 99.9 /100 | #30 | Exceptional 1.9% |
| Mongolians | 99.9 /100 | #31 | Exceptional 1.9% |
| Luxembourgers | 99.9 /100 | #32 | Exceptional 1.9% |
| Immigrants | Egypt | 99.9 /100 | #33 | Exceptional 1.9% |
| Immigrants | Turkey | 99.8 /100 | #34 | Exceptional 1.9% |
| Immigrants | Australia | 99.8 /100 | #35 | Exceptional 1.9% |
| Cambodians | 99.8 /100 | #36 | Exceptional 2.0% |
| Bhutanese | 99.8 /100 | #37 | Exceptional 2.0% |
| Immigrants | Kuwait | 99.8 /100 | #38 | Exceptional 2.0% |
| Zimbabweans | 99.7 /100 | #39 | Exceptional 2.0% |
Demographics Similar to Jamaicans by Vision Disability
In terms of vision disability, the demographic groups most similar to Jamaicans are Fijian (2.4%, a difference of 0.030%), Belizean (2.4%, a difference of 0.24%), Immigrants from Belize (2.4%, a difference of 0.26%), Immigrants from Liberia (2.4%, a difference of 0.38%), and Immigrants from Jamaica (2.4%, a difference of 0.40%).
| Demographics | Rating | Rank | Vision Disability |
| Immigrants | Guatemala | 0.3 /100 | #255 | Tragic 2.4% |
| Immigrants | Haiti | 0.2 /100 | #256 | Tragic 2.4% |
| West Indians | 0.2 /100 | #257 | Tragic 2.4% |
| British West Indians | 0.2 /100 | #258 | Tragic 2.4% |
| Whites/Caucasians | 0.2 /100 | #259 | Tragic 2.4% |
| Belizeans | 0.2 /100 | #260 | Tragic 2.4% |
| Fijians | 0.1 /100 | #261 | Tragic 2.4% |
| Jamaicans | 0.1 /100 | #262 | Tragic 2.4% |
| Immigrants | Belize | 0.1 /100 | #263 | Tragic 2.4% |
| Immigrants | Liberia | 0.1 /100 | #264 | Tragic 2.4% |
| Immigrants | Jamaica | 0.1 /100 | #265 | Tragic 2.4% |
| Mexican American Indians | 0.1 /100 | #266 | Tragic 2.4% |
| Ute | 0.1 /100 | #267 | Tragic 2.4% |
| Senegalese | 0.1 /100 | #268 | Tragic 2.4% |
| Celtics | 0.1 /100 | #269 | Tragic 2.4% |