Luxembourger vs Immigrants from India Vision Disability
COMPARE
Luxembourger
Immigrants from India
Vision Disability
Vision Disability Comparison
Luxembourgers
Immigrants from India
1.9%
VISION DISABILITY
99.9/ 100
METRIC RATING
32nd/ 347
METRIC RANK
1.7%
VISION DISABILITY
100.0/ 100
METRIC RATING
1st/ 347
METRIC RANK
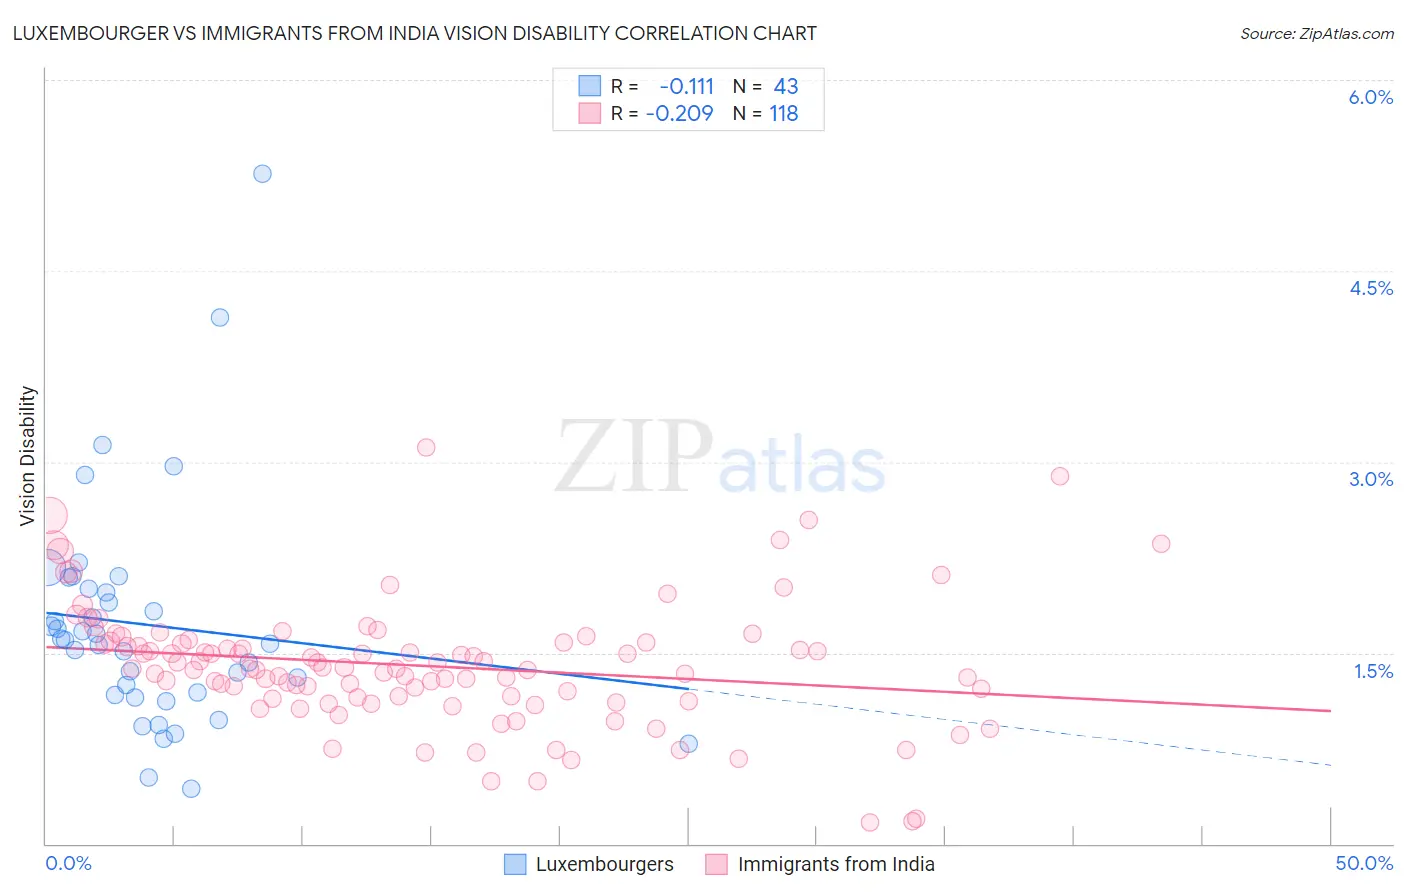
Luxembourger vs Immigrants from India Vision Disability Correlation Chart
The statistical analysis conducted on geographies consisting of 144,652,316 people shows a poor negative correlation between the proportion of Luxembourgers and percentage of population with vision disability in the United States with a correlation coefficient (R) of -0.111 and weighted average of 1.9%. Similarly, the statistical analysis conducted on geographies consisting of 433,750,609 people shows a weak negative correlation between the proportion of Immigrants from India and percentage of population with vision disability in the United States with a correlation coefficient (R) of -0.209 and weighted average of 1.7%, a difference of 15.1%.
Vision Disability Correlation Summary
| Measurement | Luxembourger | Immigrants from India |
| Minimum | 0.43% | 0.17% |
| Maximum | 5.3% | 3.1% |
| Range | 4.8% | 2.9% |
| Mean | 1.7% | 1.4% |
| Median | 1.6% | 1.4% |
| Interquartile 25% (IQ1) | 1.2% | 1.2% |
| Interquartile 75% (IQ3) | 2.0% | 1.6% |
| Interquartile Range (IQR) | 0.84% | 0.43% |
| Standard Deviation (Sample) | 0.90% | 0.49% |
| Standard Deviation (Population) | 0.89% | 0.49% |
Similar Demographics by Vision Disability
Demographics Similar to Luxembourgers by Vision Disability
In terms of vision disability, the demographic groups most similar to Luxembourgers are Mongolian (1.9%, a difference of 0.27%), Immigrants from Egypt (1.9%, a difference of 0.31%), Immigrants from Nepal (1.9%, a difference of 0.43%), Immigrants from Turkey (1.9%, a difference of 0.43%), and Egyptian (1.9%, a difference of 0.47%).
| Demographics | Rating | Rank | Vision Disability |
| Bulgarians | 99.9 /100 | #25 | Exceptional 1.9% |
| Immigrants | Japan | 99.9 /100 | #26 | Exceptional 1.9% |
| Taiwanese | 99.9 /100 | #27 | Exceptional 1.9% |
| Immigrants | Malaysia | 99.9 /100 | #28 | Exceptional 1.9% |
| Egyptians | 99.9 /100 | #29 | Exceptional 1.9% |
| Immigrants | Nepal | 99.9 /100 | #30 | Exceptional 1.9% |
| Mongolians | 99.9 /100 | #31 | Exceptional 1.9% |
| Luxembourgers | 99.9 /100 | #32 | Exceptional 1.9% |
| Immigrants | Egypt | 99.9 /100 | #33 | Exceptional 1.9% |
| Immigrants | Turkey | 99.8 /100 | #34 | Exceptional 1.9% |
| Immigrants | Australia | 99.8 /100 | #35 | Exceptional 1.9% |
| Cambodians | 99.8 /100 | #36 | Exceptional 2.0% |
| Bhutanese | 99.8 /100 | #37 | Exceptional 2.0% |
| Immigrants | Kuwait | 99.8 /100 | #38 | Exceptional 2.0% |
| Zimbabweans | 99.7 /100 | #39 | Exceptional 2.0% |
Demographics Similar to Immigrants from India by Vision Disability
In terms of vision disability, the demographic groups most similar to Immigrants from India are Filipino (1.7%, a difference of 0.050%), Immigrants from Taiwan (1.7%, a difference of 0.71%), Thai (1.7%, a difference of 3.4%), Okinawan (1.8%, a difference of 5.3%), and Immigrants from Iran (1.8%, a difference of 6.0%).
| Demographics | Rating | Rank | Vision Disability |
| Immigrants | India | 100.0 /100 | #1 | Exceptional 1.7% |
| Filipinos | 100.0 /100 | #2 | Exceptional 1.7% |
| Immigrants | Taiwan | 100.0 /100 | #3 | Exceptional 1.7% |
| Thais | 100.0 /100 | #4 | Exceptional 1.7% |
| Okinawans | 100.0 /100 | #5 | Exceptional 1.8% |
| Immigrants | Iran | 100.0 /100 | #6 | Exceptional 1.8% |
| Immigrants | South Central Asia | 100.0 /100 | #7 | Exceptional 1.8% |
| Iranians | 100.0 /100 | #8 | Exceptional 1.8% |
| Immigrants | Singapore | 100.0 /100 | #9 | Exceptional 1.8% |
| Immigrants | Hong Kong | 100.0 /100 | #10 | Exceptional 1.8% |
| Immigrants | Israel | 100.0 /100 | #11 | Exceptional 1.8% |
| Immigrants | Korea | 100.0 /100 | #12 | Exceptional 1.8% |
| Immigrants | Eastern Asia | 100.0 /100 | #13 | Exceptional 1.8% |
| Immigrants | China | 100.0 /100 | #14 | Exceptional 1.8% |
| Immigrants | Bolivia | 100.0 /100 | #15 | Exceptional 1.8% |