Luxembourger vs South American 7th Grade
COMPARE
Luxembourger
South American
7th Grade
7th Grade Comparison
Luxembourgers
South Americans
97.2%
7TH GRADE
100.0/ 100
METRIC RATING
40th/ 347
METRIC RANK
95.2%
7TH GRADE
0.5/ 100
METRIC RATING
261st/ 347
METRIC RANK
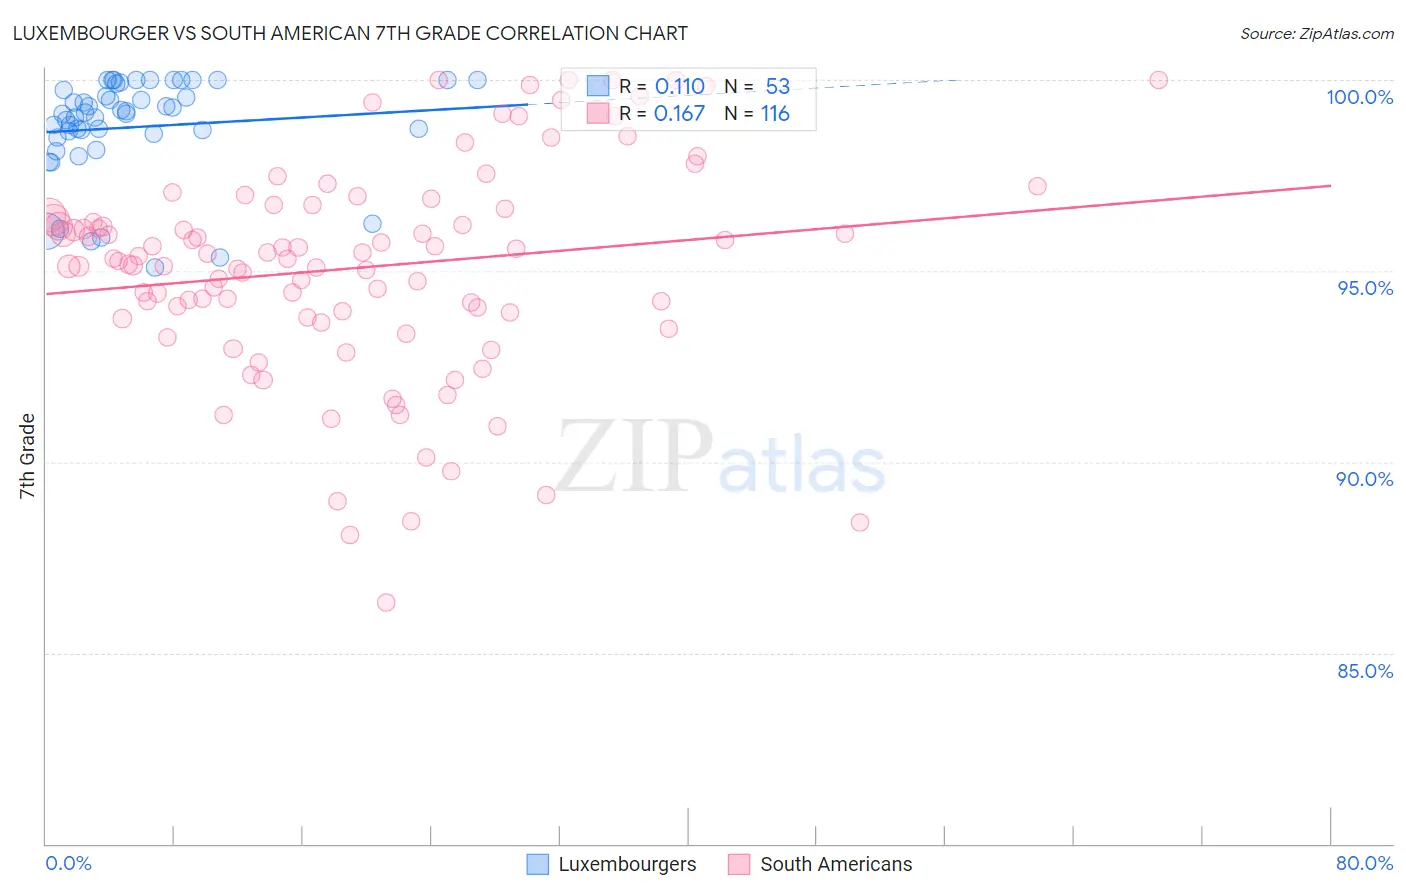
Luxembourger vs South American 7th Grade Correlation Chart
The statistical analysis conducted on geographies consisting of 144,676,190 people shows a poor positive correlation between the proportion of Luxembourgers and percentage of population with at least 7th grade education in the United States with a correlation coefficient (R) of 0.110 and weighted average of 97.2%. Similarly, the statistical analysis conducted on geographies consisting of 494,065,697 people shows a poor positive correlation between the proportion of South Americans and percentage of population with at least 7th grade education in the United States with a correlation coefficient (R) of 0.167 and weighted average of 95.2%, a difference of 2.1%.
7th Grade Correlation Summary
| Measurement | Luxembourger | South American |
| Minimum | 95.1% | 86.3% |
| Maximum | 100.0% | 100.0% |
| Range | 4.9% | 13.7% |
| Mean | 98.8% | 95.1% |
| Median | 99.1% | 95.3% |
| Interquartile 25% (IQ1) | 98.5% | 93.8% |
| Interquartile 75% (IQ3) | 99.8% | 96.5% |
| Interquartile Range (IQR) | 1.3% | 2.7% |
| Standard Deviation (Sample) | 1.3% | 2.8% |
| Standard Deviation (Population) | 1.3% | 2.8% |
Similar Demographics by 7th Grade
Demographics Similar to Luxembourgers by 7th Grade
In terms of 7th grade, the demographic groups most similar to Luxembourgers are Latvian (97.2%, a difference of 0.0%), Belgian (97.2%, a difference of 0.010%), British (97.2%, a difference of 0.020%), Eastern European (97.2%, a difference of 0.020%), and Hungarian (97.2%, a difference of 0.030%).
| Demographics | Rating | Rank | 7th Grade |
| Chippewa | 100.0 /100 | #33 | Exceptional 97.3% |
| Alaska Natives | 100.0 /100 | #34 | Exceptional 97.3% |
| Swiss | 100.0 /100 | #35 | Exceptional 97.3% |
| Hungarians | 100.0 /100 | #36 | Exceptional 97.2% |
| British | 100.0 /100 | #37 | Exceptional 97.2% |
| Belgians | 100.0 /100 | #38 | Exceptional 97.2% |
| Latvians | 100.0 /100 | #39 | Exceptional 97.2% |
| Luxembourgers | 100.0 /100 | #40 | Exceptional 97.2% |
| Eastern Europeans | 100.0 /100 | #41 | Exceptional 97.2% |
| Chinese | 99.9 /100 | #42 | Exceptional 97.1% |
| Maltese | 99.9 /100 | #43 | Exceptional 97.1% |
| Northern Europeans | 99.9 /100 | #44 | Exceptional 97.1% |
| Czechoslovakians | 99.9 /100 | #45 | Exceptional 97.1% |
| Aleuts | 99.9 /100 | #46 | Exceptional 97.1% |
| Bulgarians | 99.9 /100 | #47 | Exceptional 97.1% |
Demographics Similar to South Americans by 7th Grade
In terms of 7th grade, the demographic groups most similar to South Americans are Immigrants from Somalia (95.2%, a difference of 0.0%), West Indian (95.2%, a difference of 0.0%), Afghan (95.3%, a difference of 0.010%), Immigrants from Nigeria (95.2%, a difference of 0.010%), and Immigrants from Costa Rica (95.3%, a difference of 0.040%).
| Demographics | Rating | Rank | 7th Grade |
| Colombians | 0.8 /100 | #254 | Tragic 95.3% |
| Koreans | 0.8 /100 | #255 | Tragic 95.3% |
| Immigrants | China | 0.7 /100 | #256 | Tragic 95.3% |
| Immigrants | Congo | 0.7 /100 | #257 | Tragic 95.3% |
| Ghanaians | 0.7 /100 | #258 | Tragic 95.3% |
| Immigrants | Costa Rica | 0.6 /100 | #259 | Tragic 95.3% |
| Afghans | 0.5 /100 | #260 | Tragic 95.3% |
| South Americans | 0.5 /100 | #261 | Tragic 95.2% |
| Immigrants | Somalia | 0.5 /100 | #262 | Tragic 95.2% |
| West Indians | 0.5 /100 | #263 | Tragic 95.2% |
| Immigrants | Nigeria | 0.4 /100 | #264 | Tragic 95.2% |
| Immigrants | Uruguay | 0.3 /100 | #265 | Tragic 95.2% |
| Immigrants | Ghana | 0.3 /100 | #266 | Tragic 95.2% |
| Yuman | 0.3 /100 | #267 | Tragic 95.2% |
| Immigrants | Hong Kong | 0.3 /100 | #268 | Tragic 95.2% |