Luxembourger vs Lebanese Vision Disability
COMPARE
Luxembourger
Lebanese
Vision Disability
Vision Disability Comparison
Luxembourgers
Lebanese
1.9%
VISION DISABILITY
99.9/ 100
METRIC RATING
32nd/ 347
METRIC RANK
2.2%
VISION DISABILITY
54.3/ 100
METRIC RATING
171st/ 347
METRIC RANK
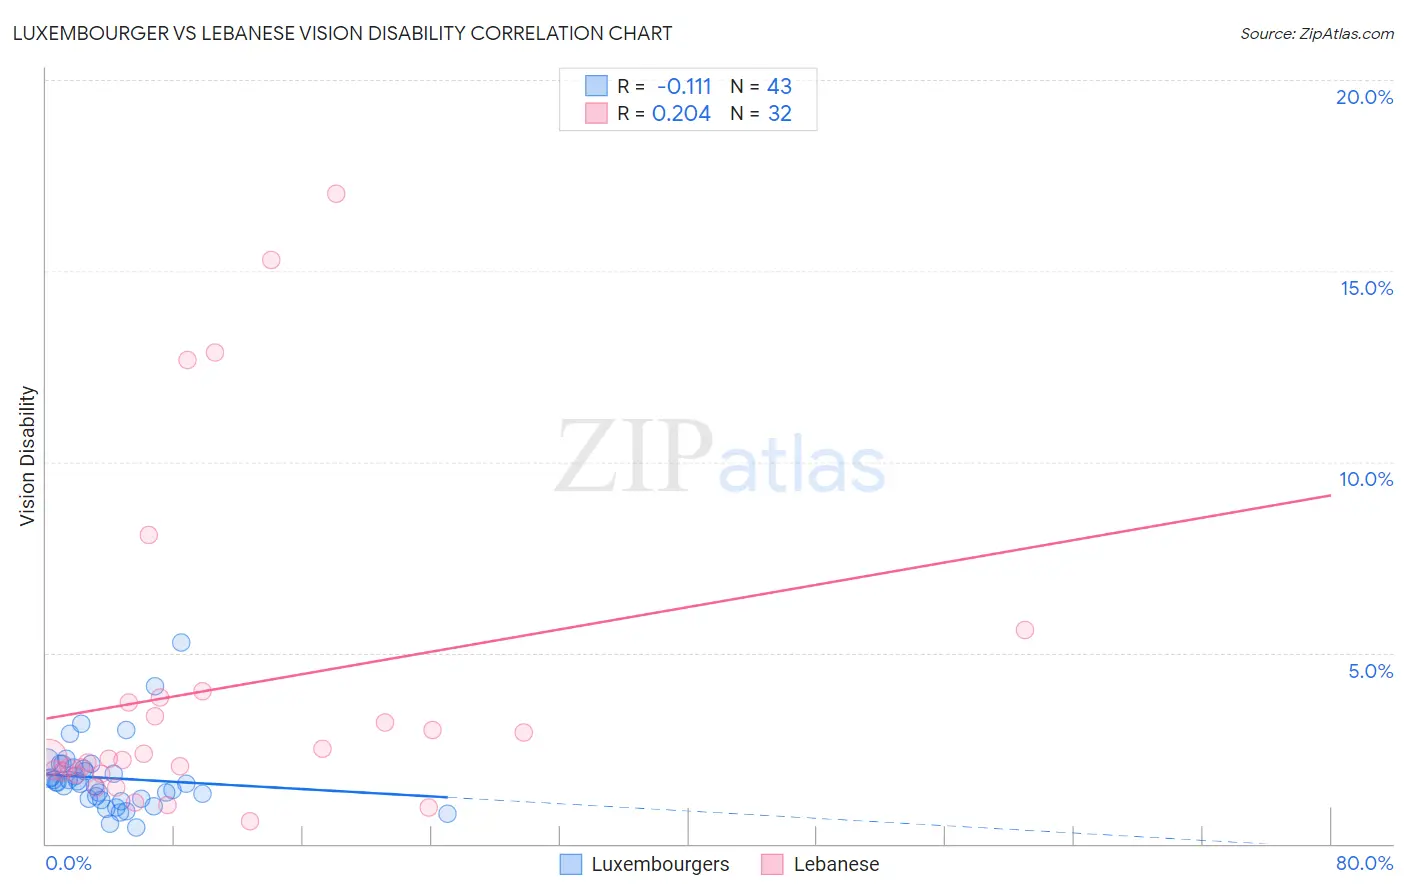
Luxembourger vs Lebanese Vision Disability Correlation Chart
The statistical analysis conducted on geographies consisting of 144,652,316 people shows a poor negative correlation between the proportion of Luxembourgers and percentage of population with vision disability in the United States with a correlation coefficient (R) of -0.111 and weighted average of 1.9%. Similarly, the statistical analysis conducted on geographies consisting of 401,298,237 people shows a weak positive correlation between the proportion of Lebanese and percentage of population with vision disability in the United States with a correlation coefficient (R) of 0.204 and weighted average of 2.2%, a difference of 11.5%.
Vision Disability Correlation Summary
| Measurement | Luxembourger | Lebanese |
| Minimum | 0.43% | 0.58% |
| Maximum | 5.3% | 17.0% |
| Range | 4.8% | 16.4% |
| Mean | 1.7% | 4.0% |
| Median | 1.6% | 2.3% |
| Interquartile 25% (IQ1) | 1.2% | 1.9% |
| Interquartile 75% (IQ3) | 2.0% | 3.8% |
| Interquartile Range (IQR) | 0.84% | 1.9% |
| Standard Deviation (Sample) | 0.90% | 4.3% |
| Standard Deviation (Population) | 0.89% | 4.2% |
Similar Demographics by Vision Disability
Demographics Similar to Luxembourgers by Vision Disability
In terms of vision disability, the demographic groups most similar to Luxembourgers are Mongolian (1.9%, a difference of 0.27%), Immigrants from Egypt (1.9%, a difference of 0.31%), Immigrants from Nepal (1.9%, a difference of 0.43%), Immigrants from Turkey (1.9%, a difference of 0.43%), and Egyptian (1.9%, a difference of 0.47%).
| Demographics | Rating | Rank | Vision Disability |
| Bulgarians | 99.9 /100 | #25 | Exceptional 1.9% |
| Immigrants | Japan | 99.9 /100 | #26 | Exceptional 1.9% |
| Taiwanese | 99.9 /100 | #27 | Exceptional 1.9% |
| Immigrants | Malaysia | 99.9 /100 | #28 | Exceptional 1.9% |
| Egyptians | 99.9 /100 | #29 | Exceptional 1.9% |
| Immigrants | Nepal | 99.9 /100 | #30 | Exceptional 1.9% |
| Mongolians | 99.9 /100 | #31 | Exceptional 1.9% |
| Luxembourgers | 99.9 /100 | #32 | Exceptional 1.9% |
| Immigrants | Egypt | 99.9 /100 | #33 | Exceptional 1.9% |
| Immigrants | Turkey | 99.8 /100 | #34 | Exceptional 1.9% |
| Immigrants | Australia | 99.8 /100 | #35 | Exceptional 1.9% |
| Cambodians | 99.8 /100 | #36 | Exceptional 2.0% |
| Bhutanese | 99.8 /100 | #37 | Exceptional 2.0% |
| Immigrants | Kuwait | 99.8 /100 | #38 | Exceptional 2.0% |
| Zimbabweans | 99.7 /100 | #39 | Exceptional 2.0% |
Demographics Similar to Lebanese by Vision Disability
In terms of vision disability, the demographic groups most similar to Lebanese are Swiss (2.2%, a difference of 0.090%), South American Indian (2.2%, a difference of 0.20%), Northern European (2.2%, a difference of 0.26%), Scandinavian (2.2%, a difference of 0.27%), and Immigrants from Canada (2.2%, a difference of 0.27%).
| Demographics | Rating | Rank | Vision Disability |
| Immigrants | Bangladesh | 65.5 /100 | #164 | Good 2.1% |
| Immigrants | Iraq | 64.8 /100 | #165 | Good 2.1% |
| Immigrants | England | 62.8 /100 | #166 | Good 2.1% |
| Immigrants | Africa | 62.6 /100 | #167 | Good 2.1% |
| Brazilians | 62.2 /100 | #168 | Good 2.1% |
| South American Indians | 57.4 /100 | #169 | Average 2.2% |
| Swiss | 55.7 /100 | #170 | Average 2.2% |
| Lebanese | 54.3 /100 | #171 | Average 2.2% |
| Northern Europeans | 50.1 /100 | #172 | Average 2.2% |
| Scandinavians | 50.0 /100 | #173 | Average 2.2% |
| Immigrants | Canada | 50.0 /100 | #174 | Average 2.2% |
| Immigrants | Fiji | 47.6 /100 | #175 | Average 2.2% |
| Yugoslavians | 46.5 /100 | #176 | Average 2.2% |
| Slavs | 46.0 /100 | #177 | Average 2.2% |
| Immigrants | Oceania | 45.1 /100 | #178 | Average 2.2% |