Yugoslavian vs South American Vision Disability
COMPARE
Yugoslavian
South American
Vision Disability
Vision Disability Comparison
Yugoslavians
South Americans
2.2%
VISION DISABILITY
46.5/ 100
METRIC RATING
176th/ 347
METRIC RANK
2.1%
VISION DISABILITY
82.8/ 100
METRIC RATING
142nd/ 347
METRIC RANK
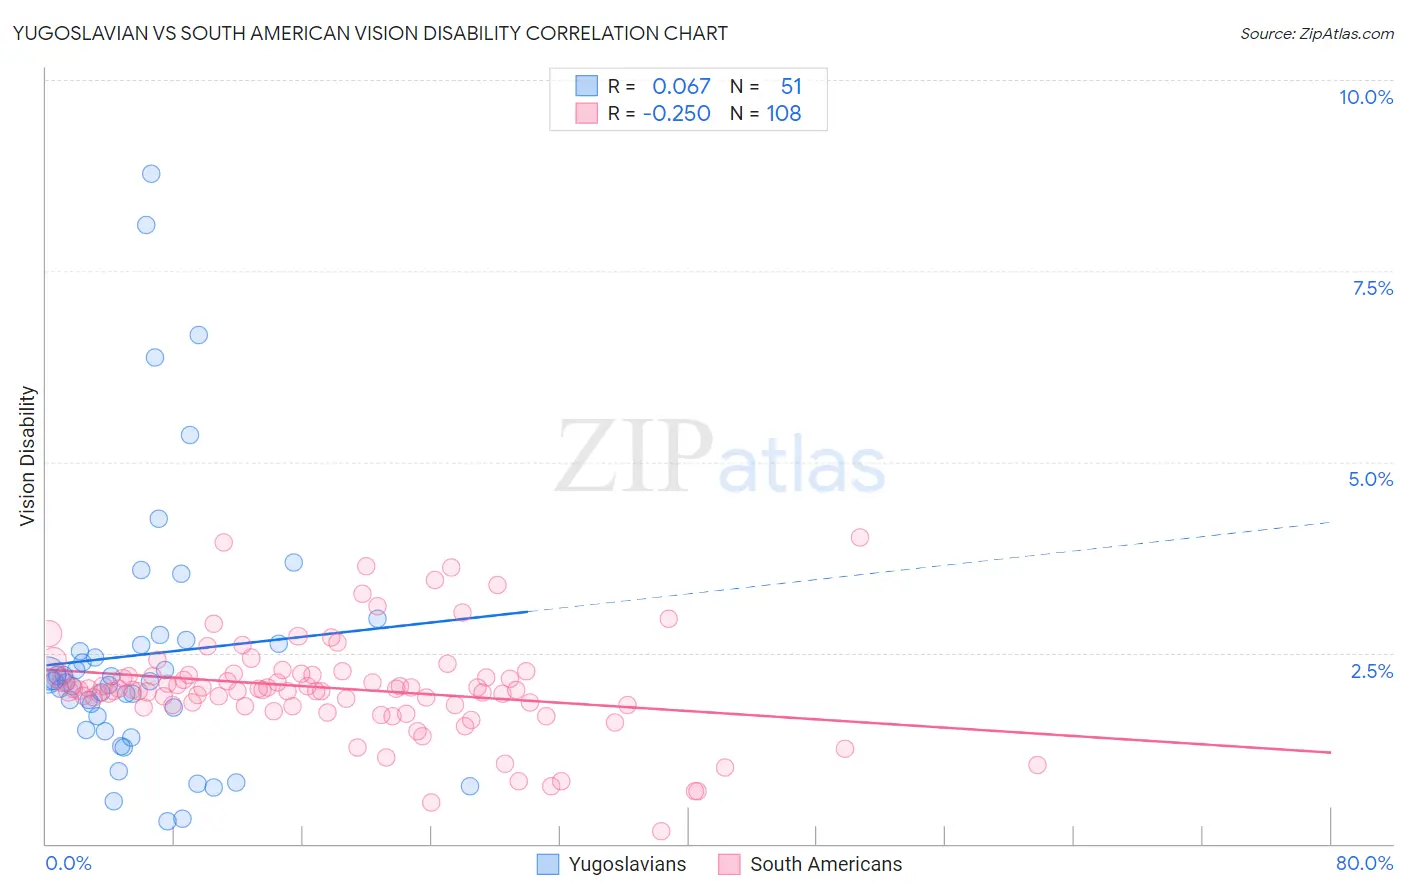
Yugoslavian vs South American Vision Disability Correlation Chart
The statistical analysis conducted on geographies consisting of 285,572,549 people shows a slight positive correlation between the proportion of Yugoslavians and percentage of population with vision disability in the United States with a correlation coefficient (R) of 0.067 and weighted average of 2.2%. Similarly, the statistical analysis conducted on geographies consisting of 493,362,805 people shows a weak negative correlation between the proportion of South Americans and percentage of population with vision disability in the United States with a correlation coefficient (R) of -0.250 and weighted average of 2.1%, a difference of 2.8%.
Vision Disability Correlation Summary
| Measurement | Yugoslavian | South American |
| Minimum | 0.30% | 0.16% |
| Maximum | 8.8% | 4.0% |
| Range | 8.5% | 3.9% |
| Mean | 2.5% | 2.0% |
| Median | 2.1% | 2.0% |
| Interquartile 25% (IQ1) | 1.5% | 1.8% |
| Interquartile 75% (IQ3) | 2.6% | 2.2% |
| Interquartile Range (IQR) | 1.1% | 0.40% |
| Standard Deviation (Sample) | 1.8% | 0.66% |
| Standard Deviation (Population) | 1.8% | 0.66% |
Similar Demographics by Vision Disability
Demographics Similar to Yugoslavians by Vision Disability
In terms of vision disability, the demographic groups most similar to Yugoslavians are Slavic (2.2%, a difference of 0.040%), Immigrants from Fiji (2.2%, a difference of 0.070%), Immigrants from Oceania (2.2%, a difference of 0.090%), Immigrants from North America (2.2%, a difference of 0.13%), and Northern European (2.2%, a difference of 0.22%).
| Demographics | Rating | Rank | Vision Disability |
| South American Indians | 57.4 /100 | #169 | Average 2.2% |
| Swiss | 55.7 /100 | #170 | Average 2.2% |
| Lebanese | 54.3 /100 | #171 | Average 2.2% |
| Northern Europeans | 50.1 /100 | #172 | Average 2.2% |
| Scandinavians | 50.0 /100 | #173 | Average 2.2% |
| Immigrants | Canada | 50.0 /100 | #174 | Average 2.2% |
| Immigrants | Fiji | 47.6 /100 | #175 | Average 2.2% |
| Yugoslavians | 46.5 /100 | #176 | Average 2.2% |
| Slavs | 46.0 /100 | #177 | Average 2.2% |
| Immigrants | Oceania | 45.1 /100 | #178 | Average 2.2% |
| Immigrants | North America | 44.5 /100 | #179 | Average 2.2% |
| Uruguayans | 42.7 /100 | #180 | Average 2.2% |
| Immigrants | Western Europe | 41.1 /100 | #181 | Average 2.2% |
| Costa Ricans | 40.7 /100 | #182 | Average 2.2% |
| Immigrants | Burma/Myanmar | 37.9 /100 | #183 | Fair 2.2% |
Demographics Similar to South Americans by Vision Disability
In terms of vision disability, the demographic groups most similar to South Americans are Immigrants from Sierra Leone (2.1%, a difference of 0.0%), Ukrainian (2.1%, a difference of 0.11%), Sierra Leonean (2.1%, a difference of 0.15%), Immigrants from Bosnia and Herzegovina (2.1%, a difference of 0.15%), and Immigrants from Netherlands (2.1%, a difference of 0.16%).
| Demographics | Rating | Rank | Vision Disability |
| Vietnamese | 86.7 /100 | #135 | Excellent 2.1% |
| Czechs | 86.3 /100 | #136 | Excellent 2.1% |
| Immigrants | South Eastern Asia | 86.3 /100 | #137 | Excellent 2.1% |
| Arabs | 86.3 /100 | #138 | Excellent 2.1% |
| Immigrants | Morocco | 85.2 /100 | #139 | Excellent 2.1% |
| Immigrants | Netherlands | 84.2 /100 | #140 | Excellent 2.1% |
| Sierra Leoneans | 84.1 /100 | #141 | Excellent 2.1% |
| South Americans | 82.8 /100 | #142 | Excellent 2.1% |
| Immigrants | Sierra Leone | 82.8 /100 | #143 | Excellent 2.1% |
| Ukrainians | 81.9 /100 | #144 | Excellent 2.1% |
| Immigrants | Bosnia and Herzegovina | 81.5 /100 | #145 | Excellent 2.1% |
| Italians | 79.7 /100 | #146 | Good 2.1% |
| Immigrants | Sudan | 78.4 /100 | #147 | Good 2.1% |
| Finns | 78.3 /100 | #148 | Good 2.1% |
| Colombians | 76.2 /100 | #149 | Good 2.1% |