Immigrants from Czechoslovakia vs South American Vision Disability
COMPARE
Immigrants from Czechoslovakia
South American
Vision Disability
Vision Disability Comparison
Immigrants from Czechoslovakia
South Americans
2.0%
VISION DISABILITY
98.7/ 100
METRIC RATING
68th/ 347
METRIC RANK
2.1%
VISION DISABILITY
82.8/ 100
METRIC RATING
142nd/ 347
METRIC RANK
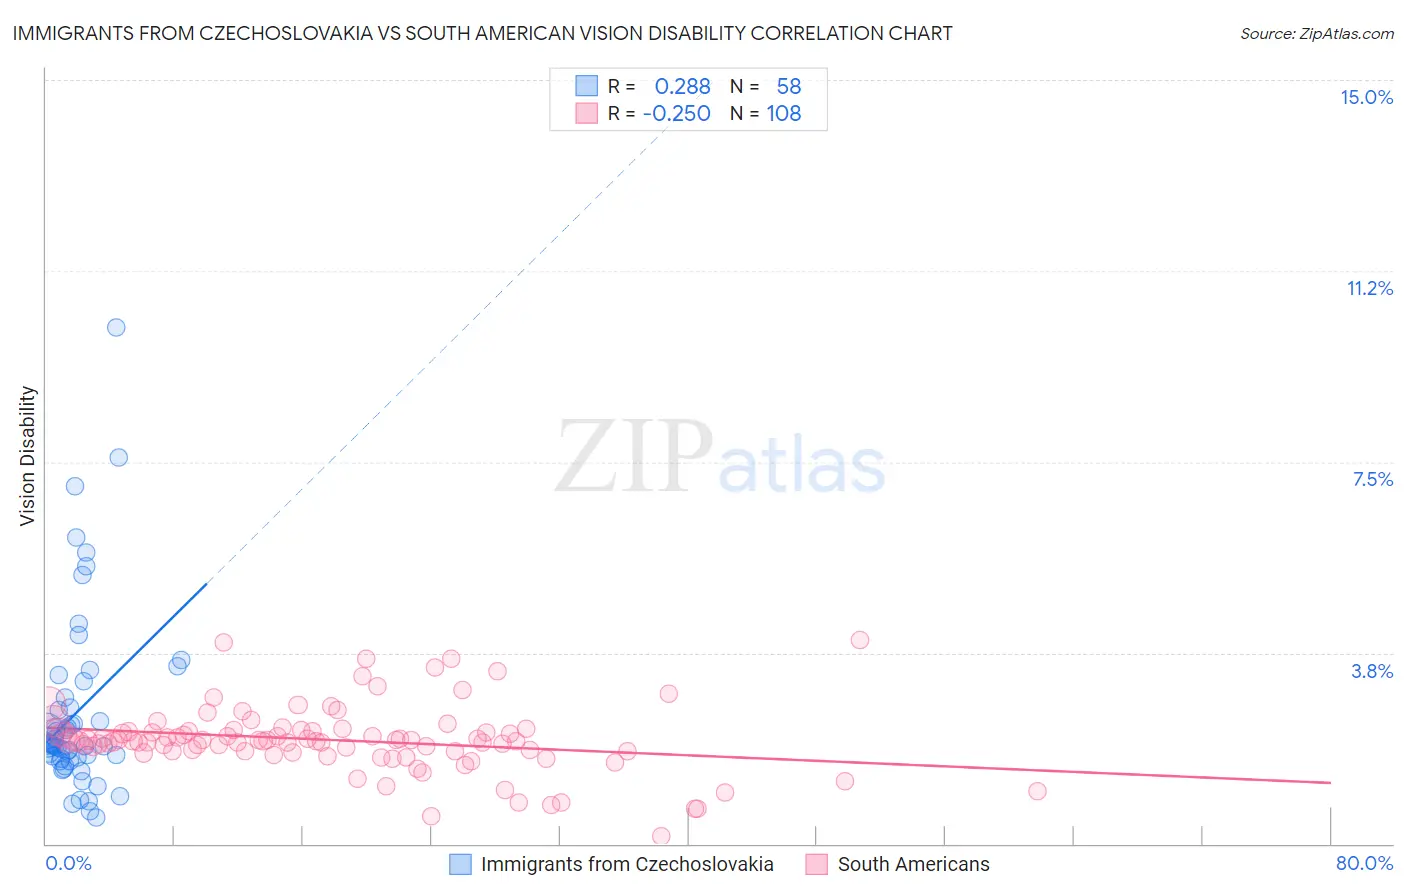
Immigrants from Czechoslovakia vs South American Vision Disability Correlation Chart
The statistical analysis conducted on geographies consisting of 195,413,823 people shows a weak positive correlation between the proportion of Immigrants from Czechoslovakia and percentage of population with vision disability in the United States with a correlation coefficient (R) of 0.288 and weighted average of 2.0%. Similarly, the statistical analysis conducted on geographies consisting of 493,362,805 people shows a weak negative correlation between the proportion of South Americans and percentage of population with vision disability in the United States with a correlation coefficient (R) of -0.250 and weighted average of 2.1%, a difference of 4.7%.
Vision Disability Correlation Summary
| Measurement | Immigrants from Czechoslovakia | South American |
| Minimum | 0.52% | 0.16% |
| Maximum | 10.1% | 4.0% |
| Range | 9.6% | 3.9% |
| Mean | 2.6% | 2.0% |
| Median | 1.9% | 2.0% |
| Interquartile 25% (IQ1) | 1.7% | 1.8% |
| Interquartile 75% (IQ3) | 2.9% | 2.2% |
| Interquartile Range (IQR) | 1.2% | 0.40% |
| Standard Deviation (Sample) | 1.8% | 0.66% |
| Standard Deviation (Population) | 1.8% | 0.66% |
Similar Demographics by Vision Disability
Demographics Similar to Immigrants from Czechoslovakia by Vision Disability
In terms of vision disability, the demographic groups most similar to Immigrants from Czechoslovakia are Immigrants from Northern Africa (2.0%, a difference of 0.10%), Russian (2.0%, a difference of 0.17%), Immigrants from Kazakhstan (2.0%, a difference of 0.19%), Immigrants from Northern Europe (2.0%, a difference of 0.20%), and Immigrants from Argentina (2.0%, a difference of 0.21%).
| Demographics | Rating | Rank | Vision Disability |
| Immigrants | Belgium | 99.1 /100 | #61 | Exceptional 2.0% |
| Immigrants | Russia | 99.1 /100 | #62 | Exceptional 2.0% |
| Armenians | 99.0 /100 | #63 | Exceptional 2.0% |
| Immigrants | Greece | 99.0 /100 | #64 | Exceptional 2.0% |
| Maltese | 98.9 /100 | #65 | Exceptional 2.0% |
| Immigrants | Argentina | 98.9 /100 | #66 | Exceptional 2.0% |
| Immigrants | Northern Africa | 98.8 /100 | #67 | Exceptional 2.0% |
| Immigrants | Czechoslovakia | 98.7 /100 | #68 | Exceptional 2.0% |
| Russians | 98.6 /100 | #69 | Exceptional 2.0% |
| Immigrants | Kazakhstan | 98.6 /100 | #70 | Exceptional 2.0% |
| Immigrants | Northern Europe | 98.6 /100 | #71 | Exceptional 2.0% |
| Immigrants | France | 98.5 /100 | #72 | Exceptional 2.0% |
| Immigrants | Eritrea | 98.4 /100 | #73 | Exceptional 2.0% |
| Palestinians | 98.3 /100 | #74 | Exceptional 2.0% |
| Immigrants | North Macedonia | 98.3 /100 | #75 | Exceptional 2.0% |
Demographics Similar to South Americans by Vision Disability
In terms of vision disability, the demographic groups most similar to South Americans are Immigrants from Sierra Leone (2.1%, a difference of 0.0%), Ukrainian (2.1%, a difference of 0.11%), Sierra Leonean (2.1%, a difference of 0.15%), Immigrants from Bosnia and Herzegovina (2.1%, a difference of 0.15%), and Immigrants from Netherlands (2.1%, a difference of 0.16%).
| Demographics | Rating | Rank | Vision Disability |
| Vietnamese | 86.7 /100 | #135 | Excellent 2.1% |
| Czechs | 86.3 /100 | #136 | Excellent 2.1% |
| Immigrants | South Eastern Asia | 86.3 /100 | #137 | Excellent 2.1% |
| Arabs | 86.3 /100 | #138 | Excellent 2.1% |
| Immigrants | Morocco | 85.2 /100 | #139 | Excellent 2.1% |
| Immigrants | Netherlands | 84.2 /100 | #140 | Excellent 2.1% |
| Sierra Leoneans | 84.1 /100 | #141 | Excellent 2.1% |
| South Americans | 82.8 /100 | #142 | Excellent 2.1% |
| Immigrants | Sierra Leone | 82.8 /100 | #143 | Excellent 2.1% |
| Ukrainians | 81.9 /100 | #144 | Excellent 2.1% |
| Immigrants | Bosnia and Herzegovina | 81.5 /100 | #145 | Excellent 2.1% |
| Italians | 79.7 /100 | #146 | Good 2.1% |
| Immigrants | Sudan | 78.4 /100 | #147 | Good 2.1% |
| Finns | 78.3 /100 | #148 | Good 2.1% |
| Colombians | 76.2 /100 | #149 | Good 2.1% |