Liberian vs South American Vision Disability
COMPARE
Liberian
South American
Vision Disability
Vision Disability Comparison
Liberians
South Americans
2.3%
VISION DISABILITY
0.5/ 100
METRIC RATING
249th/ 347
METRIC RANK
2.1%
VISION DISABILITY
82.8/ 100
METRIC RATING
142nd/ 347
METRIC RANK
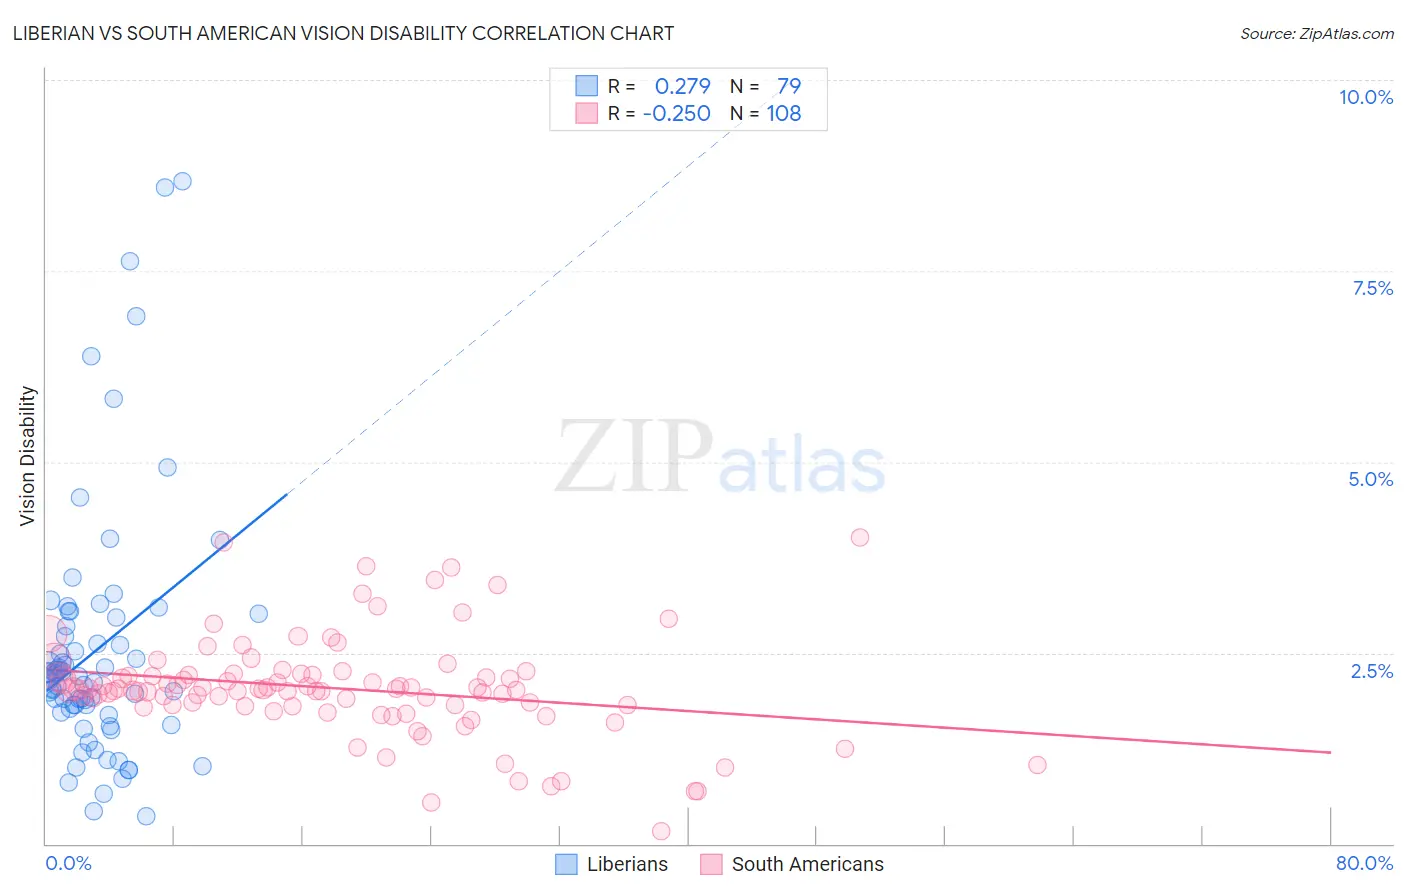
Liberian vs South American Vision Disability Correlation Chart
The statistical analysis conducted on geographies consisting of 118,074,683 people shows a weak positive correlation between the proportion of Liberians and percentage of population with vision disability in the United States with a correlation coefficient (R) of 0.279 and weighted average of 2.3%. Similarly, the statistical analysis conducted on geographies consisting of 493,362,805 people shows a weak negative correlation between the proportion of South Americans and percentage of population with vision disability in the United States with a correlation coefficient (R) of -0.250 and weighted average of 2.1%, a difference of 11.1%.
Vision Disability Correlation Summary
| Measurement | Liberian | South American |
| Minimum | 0.37% | 0.16% |
| Maximum | 8.7% | 4.0% |
| Range | 8.3% | 3.9% |
| Mean | 2.5% | 2.0% |
| Median | 2.2% | 2.0% |
| Interquartile 25% (IQ1) | 1.7% | 1.8% |
| Interquartile 75% (IQ3) | 3.0% | 2.2% |
| Interquartile Range (IQR) | 1.3% | 0.40% |
| Standard Deviation (Sample) | 1.7% | 0.66% |
| Standard Deviation (Population) | 1.6% | 0.66% |
Similar Demographics by Vision Disability
Demographics Similar to Liberians by Vision Disability
In terms of vision disability, the demographic groups most similar to Liberians are Subsaharan African (2.3%, a difference of 0.010%), Guatemalan (2.3%, a difference of 0.030%), French (2.3%, a difference of 0.070%), Bangladeshi (2.3%, a difference of 0.080%), and Immigrants from Laos (2.4%, a difference of 0.19%).
| Demographics | Rating | Rank | Vision Disability |
| Immigrants | Panama | 0.8 /100 | #242 | Tragic 2.3% |
| Immigrants | Nicaragua | 0.6 /100 | #243 | Tragic 2.3% |
| Immigrants | West Indies | 0.6 /100 | #244 | Tragic 2.3% |
| Alsatians | 0.6 /100 | #245 | Tragic 2.3% |
| French | 0.5 /100 | #246 | Tragic 2.3% |
| Guatemalans | 0.5 /100 | #247 | Tragic 2.3% |
| Sub-Saharan Africans | 0.5 /100 | #248 | Tragic 2.3% |
| Liberians | 0.5 /100 | #249 | Tragic 2.3% |
| Bangladeshis | 0.5 /100 | #250 | Tragic 2.3% |
| Immigrants | Laos | 0.4 /100 | #251 | Tragic 2.4% |
| Immigrants | Micronesia | 0.3 /100 | #252 | Tragic 2.4% |
| Japanese | 0.3 /100 | #253 | Tragic 2.4% |
| Haitians | 0.3 /100 | #254 | Tragic 2.4% |
| Immigrants | Guatemala | 0.3 /100 | #255 | Tragic 2.4% |
| Immigrants | Haiti | 0.2 /100 | #256 | Tragic 2.4% |
Demographics Similar to South Americans by Vision Disability
In terms of vision disability, the demographic groups most similar to South Americans are Immigrants from Sierra Leone (2.1%, a difference of 0.0%), Ukrainian (2.1%, a difference of 0.11%), Sierra Leonean (2.1%, a difference of 0.15%), Immigrants from Bosnia and Herzegovina (2.1%, a difference of 0.15%), and Immigrants from Netherlands (2.1%, a difference of 0.16%).
| Demographics | Rating | Rank | Vision Disability |
| Vietnamese | 86.7 /100 | #135 | Excellent 2.1% |
| Czechs | 86.3 /100 | #136 | Excellent 2.1% |
| Immigrants | South Eastern Asia | 86.3 /100 | #137 | Excellent 2.1% |
| Arabs | 86.3 /100 | #138 | Excellent 2.1% |
| Immigrants | Morocco | 85.2 /100 | #139 | Excellent 2.1% |
| Immigrants | Netherlands | 84.2 /100 | #140 | Excellent 2.1% |
| Sierra Leoneans | 84.1 /100 | #141 | Excellent 2.1% |
| South Americans | 82.8 /100 | #142 | Excellent 2.1% |
| Immigrants | Sierra Leone | 82.8 /100 | #143 | Excellent 2.1% |
| Ukrainians | 81.9 /100 | #144 | Excellent 2.1% |
| Immigrants | Bosnia and Herzegovina | 81.5 /100 | #145 | Excellent 2.1% |
| Italians | 79.7 /100 | #146 | Good 2.1% |
| Immigrants | Sudan | 78.4 /100 | #147 | Good 2.1% |
| Finns | 78.3 /100 | #148 | Good 2.1% |
| Colombians | 76.2 /100 | #149 | Good 2.1% |