Luxembourger vs Immigrants from Caribbean Vision Disability
COMPARE
Luxembourger
Immigrants from Caribbean
Vision Disability
Vision Disability Comparison
Luxembourgers
Immigrants from Caribbean
1.9%
VISION DISABILITY
99.9/ 100
METRIC RATING
32nd/ 347
METRIC RANK
2.5%
VISION DISABILITY
0.0/ 100
METRIC RATING
282nd/ 347
METRIC RANK
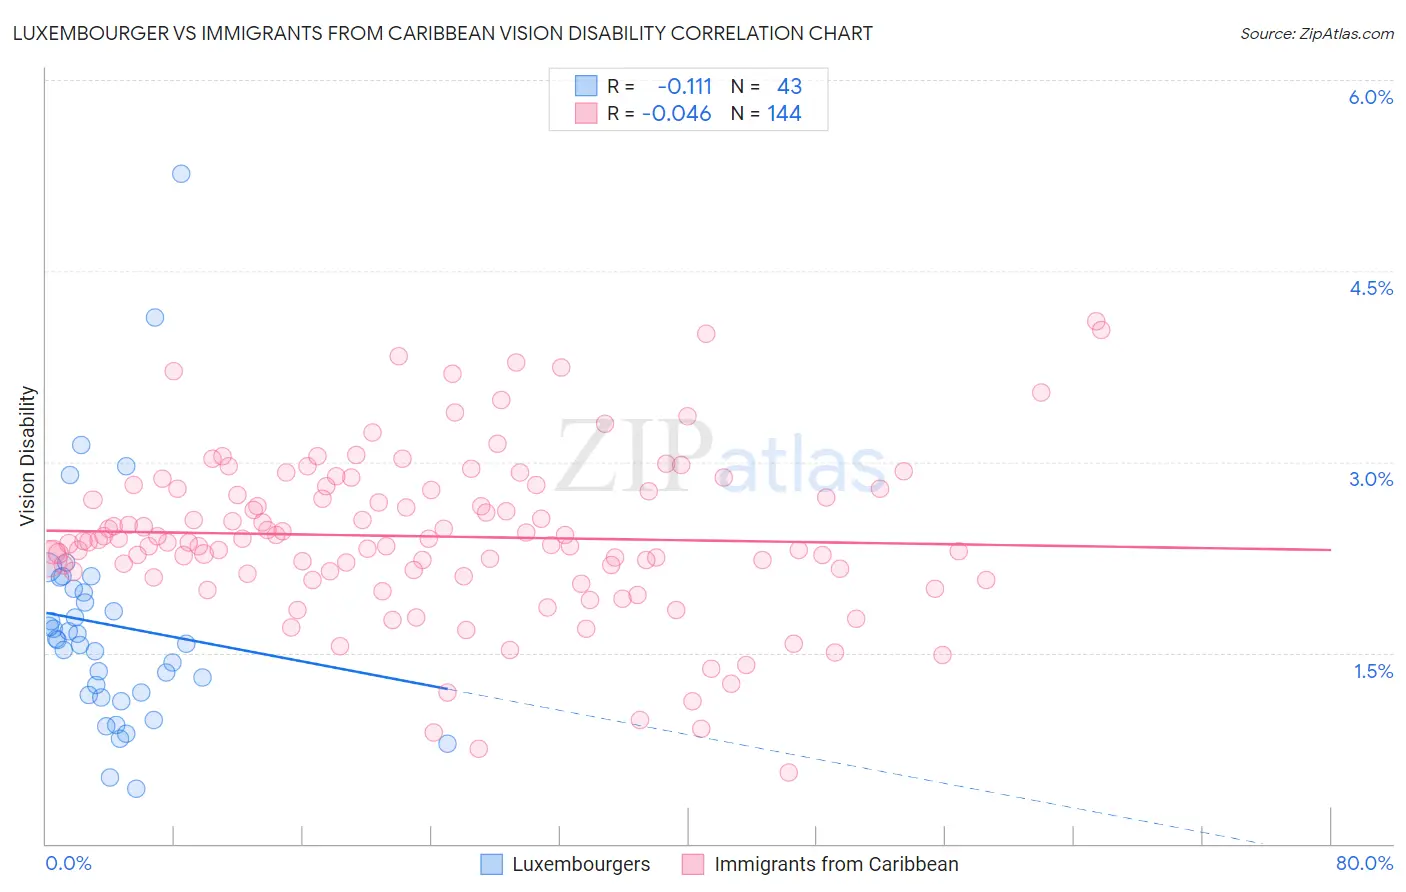
Luxembourger vs Immigrants from Caribbean Vision Disability Correlation Chart
The statistical analysis conducted on geographies consisting of 144,652,316 people shows a poor negative correlation between the proportion of Luxembourgers and percentage of population with vision disability in the United States with a correlation coefficient (R) of -0.111 and weighted average of 1.9%. Similarly, the statistical analysis conducted on geographies consisting of 449,351,147 people shows no correlation between the proportion of Immigrants from Caribbean and percentage of population with vision disability in the United States with a correlation coefficient (R) of -0.046 and weighted average of 2.5%, a difference of 26.6%.
Vision Disability Correlation Summary
| Measurement | Luxembourger | Immigrants from Caribbean |
| Minimum | 0.43% | 0.56% |
| Maximum | 5.3% | 4.1% |
| Range | 4.8% | 3.5% |
| Mean | 1.7% | 2.4% |
| Median | 1.6% | 2.4% |
| Interquartile 25% (IQ1) | 1.2% | 2.1% |
| Interquartile 75% (IQ3) | 2.0% | 2.8% |
| Interquartile Range (IQR) | 0.84% | 0.66% |
| Standard Deviation (Sample) | 0.90% | 0.65% |
| Standard Deviation (Population) | 0.89% | 0.65% |
Similar Demographics by Vision Disability
Demographics Similar to Luxembourgers by Vision Disability
In terms of vision disability, the demographic groups most similar to Luxembourgers are Mongolian (1.9%, a difference of 0.27%), Immigrants from Egypt (1.9%, a difference of 0.31%), Immigrants from Nepal (1.9%, a difference of 0.43%), Immigrants from Turkey (1.9%, a difference of 0.43%), and Egyptian (1.9%, a difference of 0.47%).
| Demographics | Rating | Rank | Vision Disability |
| Bulgarians | 99.9 /100 | #25 | Exceptional 1.9% |
| Immigrants | Japan | 99.9 /100 | #26 | Exceptional 1.9% |
| Taiwanese | 99.9 /100 | #27 | Exceptional 1.9% |
| Immigrants | Malaysia | 99.9 /100 | #28 | Exceptional 1.9% |
| Egyptians | 99.9 /100 | #29 | Exceptional 1.9% |
| Immigrants | Nepal | 99.9 /100 | #30 | Exceptional 1.9% |
| Mongolians | 99.9 /100 | #31 | Exceptional 1.9% |
| Luxembourgers | 99.9 /100 | #32 | Exceptional 1.9% |
| Immigrants | Egypt | 99.9 /100 | #33 | Exceptional 1.9% |
| Immigrants | Turkey | 99.8 /100 | #34 | Exceptional 1.9% |
| Immigrants | Australia | 99.8 /100 | #35 | Exceptional 1.9% |
| Cambodians | 99.8 /100 | #36 | Exceptional 2.0% |
| Bhutanese | 99.8 /100 | #37 | Exceptional 2.0% |
| Immigrants | Kuwait | 99.8 /100 | #38 | Exceptional 2.0% |
| Zimbabweans | 99.7 /100 | #39 | Exceptional 2.0% |
Demographics Similar to Immigrants from Caribbean by Vision Disability
In terms of vision disability, the demographic groups most similar to Immigrants from Caribbean are U.S. Virgin Islander (2.5%, a difference of 0.12%), Puget Sound Salish (2.5%, a difference of 0.13%), Cape Verdean (2.4%, a difference of 0.35%), Nepalese (2.4%, a difference of 0.39%), and Spanish (2.4%, a difference of 0.40%).
| Demographics | Rating | Rank | Vision Disability |
| Chippewa | 0.0 /100 | #275 | Tragic 2.4% |
| Scotch-Irish | 0.0 /100 | #276 | Tragic 2.4% |
| Bahamians | 0.0 /100 | #277 | Tragic 2.4% |
| Spanish | 0.0 /100 | #278 | Tragic 2.4% |
| Nepalese | 0.0 /100 | #279 | Tragic 2.4% |
| Cape Verdeans | 0.0 /100 | #280 | Tragic 2.4% |
| U.S. Virgin Islanders | 0.0 /100 | #281 | Tragic 2.5% |
| Immigrants | Caribbean | 0.0 /100 | #282 | Tragic 2.5% |
| Puget Sound Salish | 0.0 /100 | #283 | Tragic 2.5% |
| Yakama | 0.0 /100 | #284 | Tragic 2.5% |
| Immigrants | Central America | 0.0 /100 | #285 | Tragic 2.5% |
| Sioux | 0.0 /100 | #286 | Tragic 2.5% |
| Hondurans | 0.0 /100 | #287 | Tragic 2.5% |
| French American Indians | 0.0 /100 | #288 | Tragic 2.5% |
| Immigrants | Nonimmigrants | 0.0 /100 | #289 | Tragic 2.5% |