Cypriot vs Immigrants from Caribbean Vision Disability
COMPARE
Cypriot
Immigrants from Caribbean
Vision Disability
Vision Disability Comparison
Cypriots
Immigrants from Caribbean
2.0%
VISION DISABILITY
99.7/ 100
METRIC RATING
41st/ 347
METRIC RANK
2.5%
VISION DISABILITY
0.0/ 100
METRIC RATING
282nd/ 347
METRIC RANK
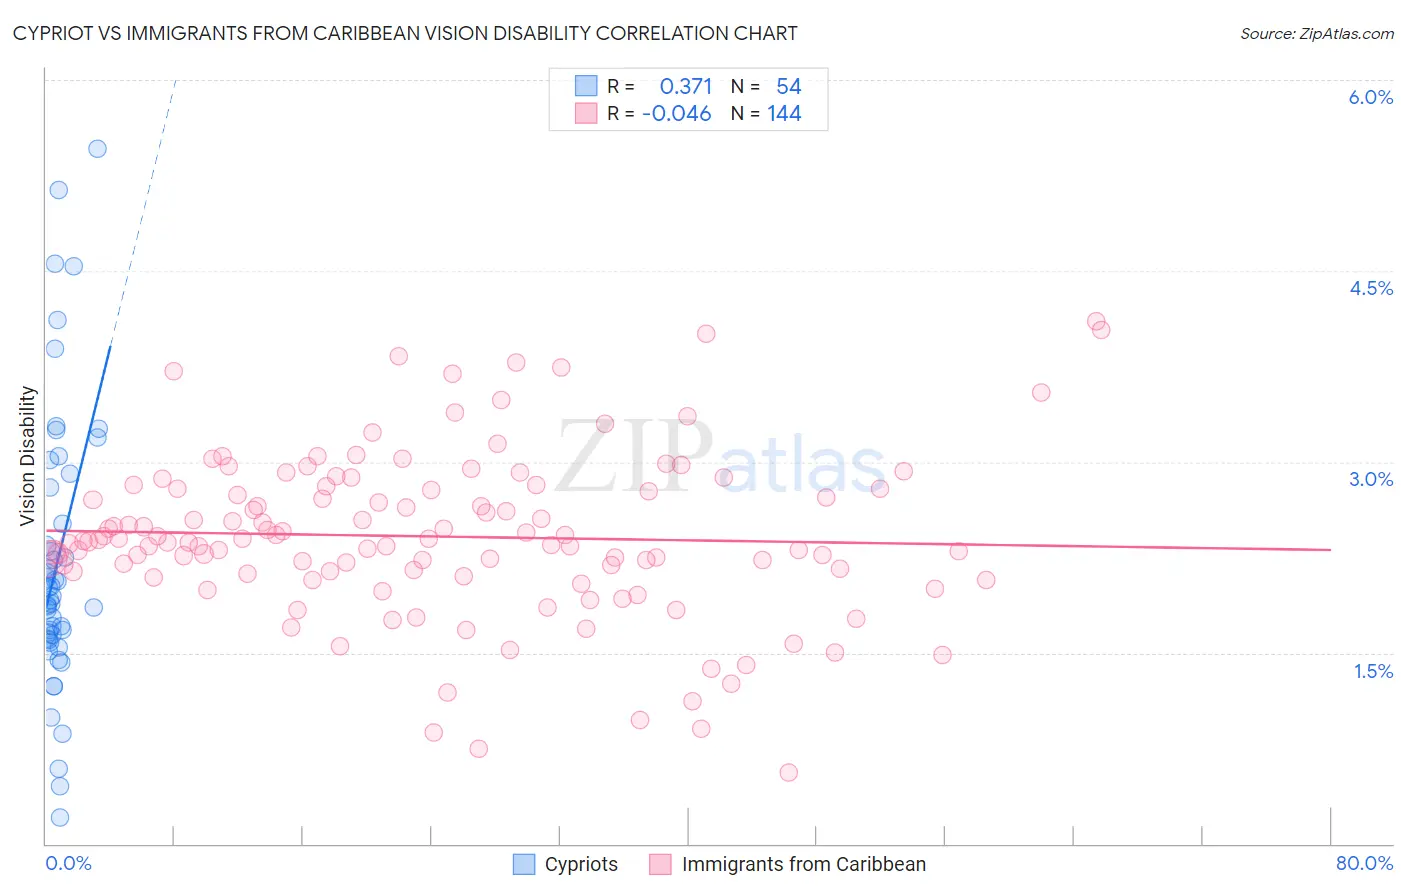
Cypriot vs Immigrants from Caribbean Vision Disability Correlation Chart
The statistical analysis conducted on geographies consisting of 61,856,516 people shows a mild positive correlation between the proportion of Cypriots and percentage of population with vision disability in the United States with a correlation coefficient (R) of 0.371 and weighted average of 2.0%. Similarly, the statistical analysis conducted on geographies consisting of 449,351,147 people shows no correlation between the proportion of Immigrants from Caribbean and percentage of population with vision disability in the United States with a correlation coefficient (R) of -0.046 and weighted average of 2.5%, a difference of 24.8%.
Vision Disability Correlation Summary
| Measurement | Cypriot | Immigrants from Caribbean |
| Minimum | 0.21% | 0.56% |
| Maximum | 5.5% | 4.1% |
| Range | 5.3% | 3.5% |
| Mean | 2.2% | 2.4% |
| Median | 1.9% | 2.4% |
| Interquartile 25% (IQ1) | 1.6% | 2.1% |
| Interquartile 75% (IQ3) | 2.8% | 2.8% |
| Interquartile Range (IQR) | 1.2% | 0.66% |
| Standard Deviation (Sample) | 1.1% | 0.65% |
| Standard Deviation (Population) | 1.1% | 0.65% |
Similar Demographics by Vision Disability
Demographics Similar to Cypriots by Vision Disability
In terms of vision disability, the demographic groups most similar to Cypriots are Immigrants from Ireland (2.0%, a difference of 0.030%), Immigrants from Ethiopia (2.0%, a difference of 0.16%), Zimbabwean (2.0%, a difference of 0.22%), Eastern European (2.0%, a difference of 0.22%), and Immigrants from Indonesia (2.0%, a difference of 0.24%).
| Demographics | Rating | Rank | Vision Disability |
| Immigrants | Turkey | 99.8 /100 | #34 | Exceptional 1.9% |
| Immigrants | Australia | 99.8 /100 | #35 | Exceptional 1.9% |
| Cambodians | 99.8 /100 | #36 | Exceptional 2.0% |
| Bhutanese | 99.8 /100 | #37 | Exceptional 2.0% |
| Immigrants | Kuwait | 99.8 /100 | #38 | Exceptional 2.0% |
| Zimbabweans | 99.7 /100 | #39 | Exceptional 2.0% |
| Immigrants | Ireland | 99.7 /100 | #40 | Exceptional 2.0% |
| Cypriots | 99.7 /100 | #41 | Exceptional 2.0% |
| Immigrants | Ethiopia | 99.7 /100 | #42 | Exceptional 2.0% |
| Eastern Europeans | 99.7 /100 | #43 | Exceptional 2.0% |
| Immigrants | Indonesia | 99.7 /100 | #44 | Exceptional 2.0% |
| Ethiopians | 99.7 /100 | #45 | Exceptional 2.0% |
| Immigrants | Sweden | 99.7 /100 | #46 | Exceptional 2.0% |
| Immigrants | Bulgaria | 99.7 /100 | #47 | Exceptional 2.0% |
| Israelis | 99.6 /100 | #48 | Exceptional 2.0% |
Demographics Similar to Immigrants from Caribbean by Vision Disability
In terms of vision disability, the demographic groups most similar to Immigrants from Caribbean are U.S. Virgin Islander (2.5%, a difference of 0.12%), Puget Sound Salish (2.5%, a difference of 0.13%), Cape Verdean (2.4%, a difference of 0.35%), Nepalese (2.4%, a difference of 0.39%), and Spanish (2.4%, a difference of 0.40%).
| Demographics | Rating | Rank | Vision Disability |
| Chippewa | 0.0 /100 | #275 | Tragic 2.4% |
| Scotch-Irish | 0.0 /100 | #276 | Tragic 2.4% |
| Bahamians | 0.0 /100 | #277 | Tragic 2.4% |
| Spanish | 0.0 /100 | #278 | Tragic 2.4% |
| Nepalese | 0.0 /100 | #279 | Tragic 2.4% |
| Cape Verdeans | 0.0 /100 | #280 | Tragic 2.4% |
| U.S. Virgin Islanders | 0.0 /100 | #281 | Tragic 2.5% |
| Immigrants | Caribbean | 0.0 /100 | #282 | Tragic 2.5% |
| Puget Sound Salish | 0.0 /100 | #283 | Tragic 2.5% |
| Yakama | 0.0 /100 | #284 | Tragic 2.5% |
| Immigrants | Central America | 0.0 /100 | #285 | Tragic 2.5% |
| Sioux | 0.0 /100 | #286 | Tragic 2.5% |
| Hondurans | 0.0 /100 | #287 | Tragic 2.5% |
| French American Indians | 0.0 /100 | #288 | Tragic 2.5% |
| Immigrants | Nonimmigrants | 0.0 /100 | #289 | Tragic 2.5% |