Finnish vs Immigrants from Caribbean Vision Disability
COMPARE
Finnish
Immigrants from Caribbean
Vision Disability
Vision Disability Comparison
Finns
Immigrants from Caribbean
2.1%
VISION DISABILITY
78.3/ 100
METRIC RATING
148th/ 347
METRIC RANK
2.5%
VISION DISABILITY
0.0/ 100
METRIC RATING
282nd/ 347
METRIC RANK
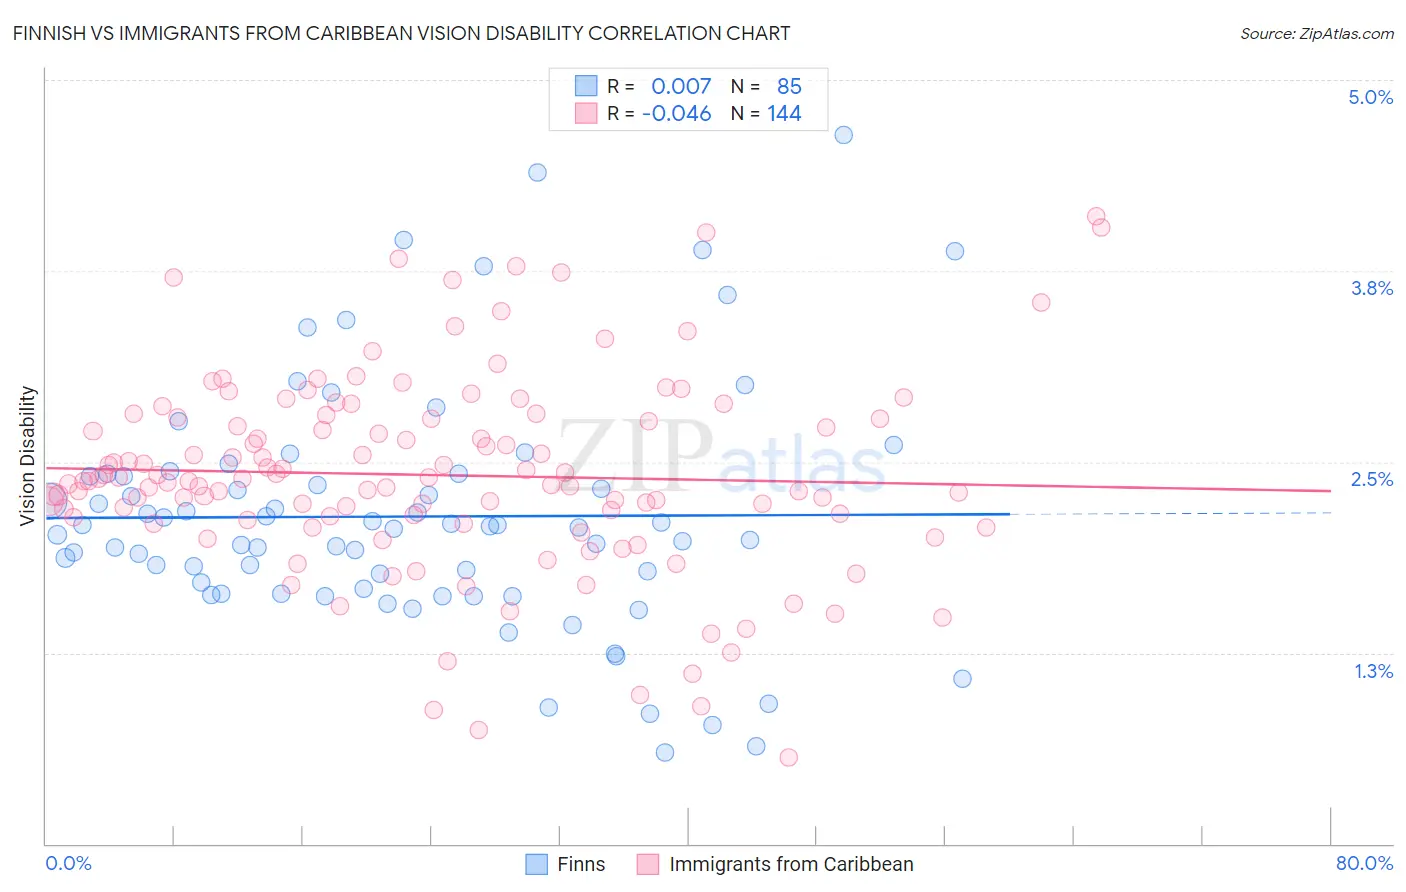
Finnish vs Immigrants from Caribbean Vision Disability Correlation Chart
The statistical analysis conducted on geographies consisting of 404,250,677 people shows no correlation between the proportion of Finns and percentage of population with vision disability in the United States with a correlation coefficient (R) of 0.007 and weighted average of 2.1%. Similarly, the statistical analysis conducted on geographies consisting of 449,351,147 people shows no correlation between the proportion of Immigrants from Caribbean and percentage of population with vision disability in the United States with a correlation coefficient (R) of -0.046 and weighted average of 2.5%, a difference of 15.7%.
Vision Disability Correlation Summary
| Measurement | Finnish | Immigrants from Caribbean |
| Minimum | 0.59% | 0.56% |
| Maximum | 4.6% | 4.1% |
| Range | 4.0% | 3.5% |
| Mean | 2.1% | 2.4% |
| Median | 2.1% | 2.4% |
| Interquartile 25% (IQ1) | 1.7% | 2.1% |
| Interquartile 75% (IQ3) | 2.4% | 2.8% |
| Interquartile Range (IQR) | 0.76% | 0.66% |
| Standard Deviation (Sample) | 0.79% | 0.65% |
| Standard Deviation (Population) | 0.79% | 0.65% |
Similar Demographics by Vision Disability
Demographics Similar to Finns by Vision Disability
In terms of vision disability, the demographic groups most similar to Finns are Immigrants from Sudan (2.1%, a difference of 0.010%), Italian (2.1%, a difference of 0.14%), Colombian (2.1%, a difference of 0.19%), Belgian (2.1%, a difference of 0.22%), and Immigrants from Norway (2.1%, a difference of 0.25%).
| Demographics | Rating | Rank | Vision Disability |
| Sierra Leoneans | 84.1 /100 | #141 | Excellent 2.1% |
| South Americans | 82.8 /100 | #142 | Excellent 2.1% |
| Immigrants | Sierra Leone | 82.8 /100 | #143 | Excellent 2.1% |
| Ukrainians | 81.9 /100 | #144 | Excellent 2.1% |
| Immigrants | Bosnia and Herzegovina | 81.5 /100 | #145 | Excellent 2.1% |
| Italians | 79.7 /100 | #146 | Good 2.1% |
| Immigrants | Sudan | 78.4 /100 | #147 | Good 2.1% |
| Finns | 78.3 /100 | #148 | Good 2.1% |
| Colombians | 76.2 /100 | #149 | Good 2.1% |
| Belgians | 75.9 /100 | #150 | Good 2.1% |
| Immigrants | Norway | 75.5 /100 | #151 | Good 2.1% |
| Immigrants | Southern Europe | 74.6 /100 | #152 | Good 2.1% |
| Immigrants | South America | 73.8 /100 | #153 | Good 2.1% |
| Slovenes | 73.6 /100 | #154 | Good 2.1% |
| Immigrants | Colombia | 72.1 /100 | #155 | Good 2.1% |
Demographics Similar to Immigrants from Caribbean by Vision Disability
In terms of vision disability, the demographic groups most similar to Immigrants from Caribbean are U.S. Virgin Islander (2.5%, a difference of 0.12%), Puget Sound Salish (2.5%, a difference of 0.13%), Cape Verdean (2.4%, a difference of 0.35%), Nepalese (2.4%, a difference of 0.39%), and Spanish (2.4%, a difference of 0.40%).
| Demographics | Rating | Rank | Vision Disability |
| Chippewa | 0.0 /100 | #275 | Tragic 2.4% |
| Scotch-Irish | 0.0 /100 | #276 | Tragic 2.4% |
| Bahamians | 0.0 /100 | #277 | Tragic 2.4% |
| Spanish | 0.0 /100 | #278 | Tragic 2.4% |
| Nepalese | 0.0 /100 | #279 | Tragic 2.4% |
| Cape Verdeans | 0.0 /100 | #280 | Tragic 2.4% |
| U.S. Virgin Islanders | 0.0 /100 | #281 | Tragic 2.5% |
| Immigrants | Caribbean | 0.0 /100 | #282 | Tragic 2.5% |
| Puget Sound Salish | 0.0 /100 | #283 | Tragic 2.5% |
| Yakama | 0.0 /100 | #284 | Tragic 2.5% |
| Immigrants | Central America | 0.0 /100 | #285 | Tragic 2.5% |
| Sioux | 0.0 /100 | #286 | Tragic 2.5% |
| Hondurans | 0.0 /100 | #287 | Tragic 2.5% |
| French American Indians | 0.0 /100 | #288 | Tragic 2.5% |
| Immigrants | Nonimmigrants | 0.0 /100 | #289 | Tragic 2.5% |