Lithuanian vs Ghanaian Female Disability
COMPARE
Lithuanian
Ghanaian
Female Disability
Female Disability Comparison
Lithuanians
Ghanaians
12.2%
FEMALE DISABILITY
59.5/ 100
METRIC RATING
166th/ 347
METRIC RANK
12.1%
FEMALE DISABILITY
76.6/ 100
METRIC RATING
155th/ 347
METRIC RANK
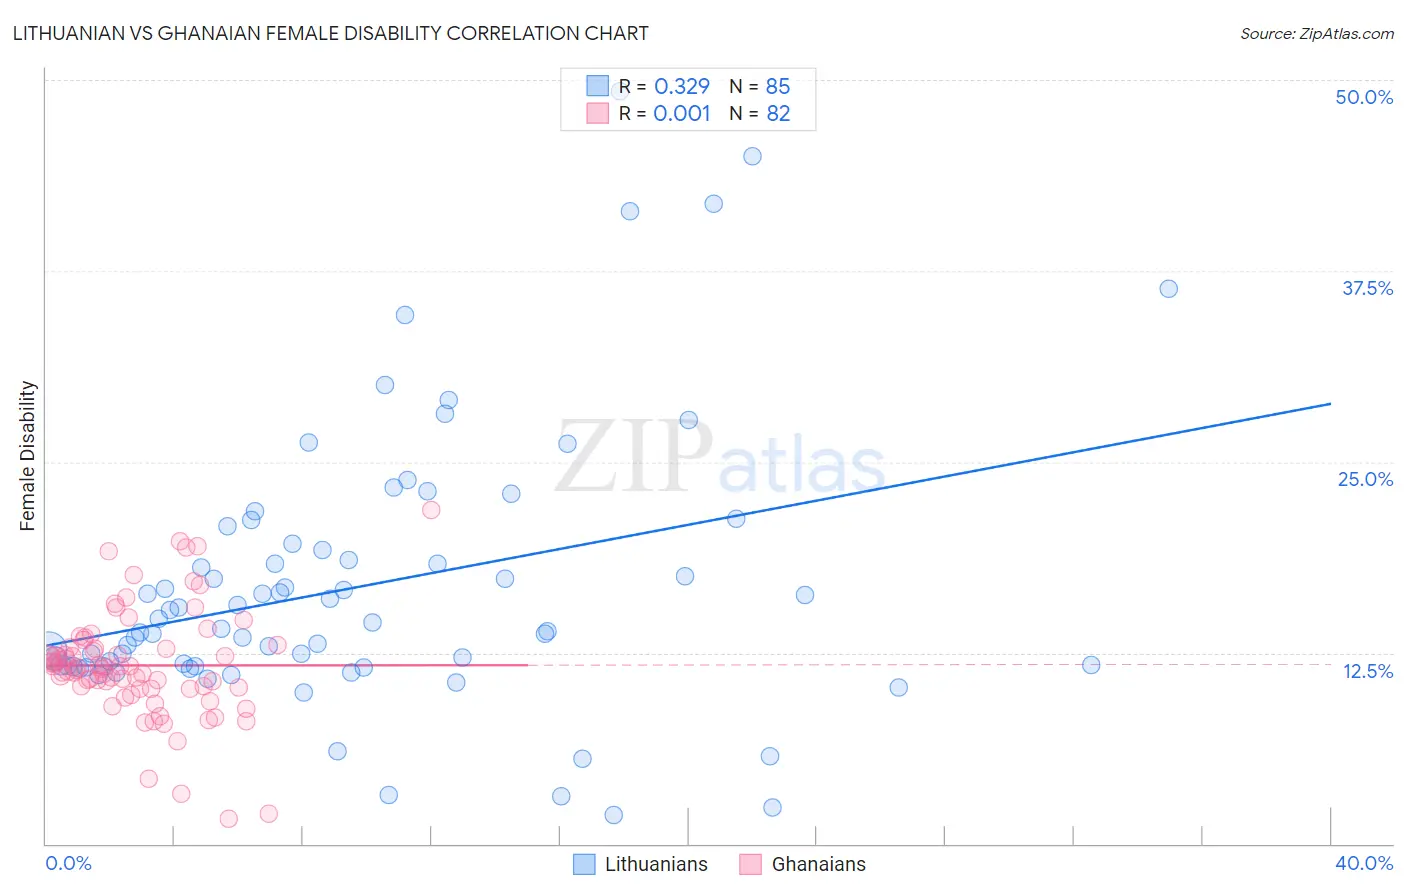
Lithuanian vs Ghanaian Female Disability Correlation Chart
The statistical analysis conducted on geographies consisting of 421,926,295 people shows a mild positive correlation between the proportion of Lithuanians and percentage of females with a disability in the United States with a correlation coefficient (R) of 0.329 and weighted average of 12.2%. Similarly, the statistical analysis conducted on geographies consisting of 190,696,570 people shows no correlation between the proportion of Ghanaians and percentage of females with a disability in the United States with a correlation coefficient (R) of 0.001 and weighted average of 12.1%, a difference of 0.76%.
Female Disability Correlation Summary
| Measurement | Lithuanian | Ghanaian |
| Minimum | 1.9% | 1.6% |
| Maximum | 49.2% | 21.9% |
| Range | 47.3% | 20.2% |
| Mean | 16.8% | 11.7% |
| Median | 14.0% | 11.5% |
| Interquartile 25% (IQ1) | 11.6% | 10.2% |
| Interquartile 75% (IQ3) | 19.4% | 12.9% |
| Interquartile Range (IQR) | 7.8% | 2.7% |
| Standard Deviation (Sample) | 9.0% | 3.6% |
| Standard Deviation (Population) | 9.0% | 3.6% |
Demographics Similar to Lithuanians and Ghanaians by Female Disability
In terms of female disability, the demographic groups most similar to Lithuanians are Immigrants from Latin America (12.2%, a difference of 0.020%), Immigrants from Haiti (12.2%, a difference of 0.030%), Lebanese (12.2%, a difference of 0.050%), Immigrants from Oceania (12.1%, a difference of 0.090%), and Maltese (12.2%, a difference of 0.10%). Similarly, the demographic groups most similar to Ghanaians are Syrian (12.1%, a difference of 0.020%), Sudanese (12.0%, a difference of 0.14%), Immigrants from Scotland (12.0%, a difference of 0.15%), Moroccan (12.1%, a difference of 0.19%), and Danish (12.1%, a difference of 0.20%).
| Demographics | Rating | Rank | Female Disability |
| Immigrants | Moldova | 81.4 /100 | #150 | Excellent 12.0% |
| Icelanders | 80.7 /100 | #151 | Excellent 12.0% |
| Immigrants | Scotland | 79.3 /100 | #152 | Good 12.0% |
| Sudanese | 79.1 /100 | #153 | Good 12.0% |
| Syrians | 76.9 /100 | #154 | Good 12.1% |
| Ghanaians | 76.6 /100 | #155 | Good 12.1% |
| Moroccans | 72.9 /100 | #156 | Good 12.1% |
| Danes | 72.5 /100 | #157 | Good 12.1% |
| Immigrants | Middle Africa | 72.4 /100 | #158 | Good 12.1% |
| Immigrants | Central America | 67.7 /100 | #159 | Good 12.1% |
| Immigrants | Guatemala | 66.0 /100 | #160 | Good 12.1% |
| Guyanese | 64.7 /100 | #161 | Good 12.1% |
| Immigrants | Ukraine | 64.3 /100 | #162 | Good 12.1% |
| Guatemalans | 63.8 /100 | #163 | Good 12.1% |
| Czechs | 63.6 /100 | #164 | Good 12.1% |
| Immigrants | Oceania | 61.8 /100 | #165 | Good 12.1% |
| Lithuanians | 59.5 /100 | #166 | Average 12.2% |
| Immigrants | Latin America | 59.0 /100 | #167 | Average 12.2% |
| Immigrants | Haiti | 58.8 /100 | #168 | Average 12.2% |
| Lebanese | 58.1 /100 | #169 | Average 12.2% |
| Maltese | 57.0 /100 | #170 | Average 12.2% |