Lithuanian vs American Female Disability
COMPARE
Lithuanian
American
Female Disability
Female Disability Comparison
Lithuanians
Americans
12.2%
FEMALE DISABILITY
59.5/ 100
METRIC RATING
166th/ 347
METRIC RANK
14.1%
FEMALE DISABILITY
0.0/ 100
METRIC RATING
320th/ 347
METRIC RANK
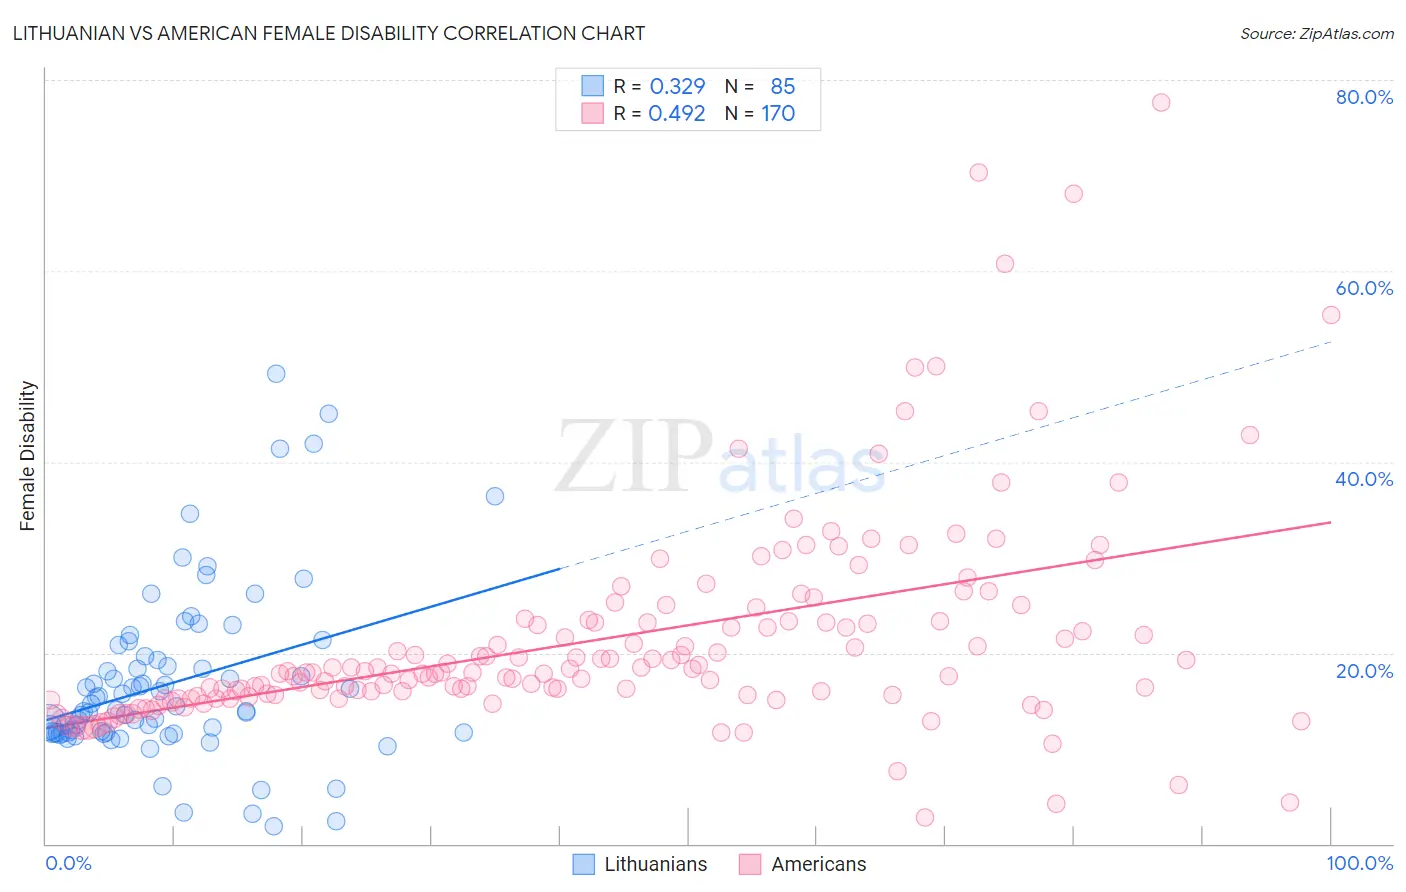
Lithuanian vs American Female Disability Correlation Chart
The statistical analysis conducted on geographies consisting of 421,926,295 people shows a mild positive correlation between the proportion of Lithuanians and percentage of females with a disability in the United States with a correlation coefficient (R) of 0.329 and weighted average of 12.2%. Similarly, the statistical analysis conducted on geographies consisting of 581,542,152 people shows a moderate positive correlation between the proportion of Americans and percentage of females with a disability in the United States with a correlation coefficient (R) of 0.492 and weighted average of 14.1%, a difference of 16.0%.
Female Disability Correlation Summary
| Measurement | Lithuanian | American |
| Minimum | 1.9% | 2.7% |
| Maximum | 49.2% | 77.6% |
| Range | 47.3% | 74.9% |
| Mean | 16.8% | 21.4% |
| Median | 14.0% | 17.9% |
| Interquartile 25% (IQ1) | 11.6% | 15.4% |
| Interquartile 75% (IQ3) | 19.4% | 23.3% |
| Interquartile Range (IQR) | 7.8% | 7.9% |
| Standard Deviation (Sample) | 9.0% | 11.3% |
| Standard Deviation (Population) | 9.0% | 11.2% |
Similar Demographics by Female Disability
Demographics Similar to Lithuanians by Female Disability
In terms of female disability, the demographic groups most similar to Lithuanians are Immigrants from Latin America (12.2%, a difference of 0.020%), Immigrants from Haiti (12.2%, a difference of 0.030%), Lebanese (12.2%, a difference of 0.050%), Immigrants from Oceania (12.1%, a difference of 0.090%), and Maltese (12.2%, a difference of 0.10%).
| Demographics | Rating | Rank | Female Disability |
| Immigrants | Central America | 67.7 /100 | #159 | Good 12.1% |
| Immigrants | Guatemala | 66.0 /100 | #160 | Good 12.1% |
| Guyanese | 64.7 /100 | #161 | Good 12.1% |
| Immigrants | Ukraine | 64.3 /100 | #162 | Good 12.1% |
| Guatemalans | 63.8 /100 | #163 | Good 12.1% |
| Czechs | 63.6 /100 | #164 | Good 12.1% |
| Immigrants | Oceania | 61.8 /100 | #165 | Good 12.1% |
| Lithuanians | 59.5 /100 | #166 | Average 12.2% |
| Immigrants | Latin America | 59.0 /100 | #167 | Average 12.2% |
| Immigrants | Haiti | 58.8 /100 | #168 | Average 12.2% |
| Lebanese | 58.1 /100 | #169 | Average 12.2% |
| Maltese | 57.0 /100 | #170 | Average 12.2% |
| Immigrants | Southern Europe | 56.3 /100 | #171 | Average 12.2% |
| Haitians | 51.9 /100 | #172 | Average 12.2% |
| Immigrants | Mexico | 50.8 /100 | #173 | Average 12.2% |
Demographics Similar to Americans by Female Disability
In terms of female disability, the demographic groups most similar to Americans are Potawatomi (14.1%, a difference of 0.14%), Pueblo (14.1%, a difference of 0.15%), Black/African American (14.1%, a difference of 0.31%), Native/Alaskan (14.1%, a difference of 0.33%), and Iroquois (14.0%, a difference of 0.34%).
| Demographics | Rating | Rank | Female Disability |
| Blackfeet | 0.0 /100 | #313 | Tragic 13.8% |
| Puget Sound Salish | 0.0 /100 | #314 | Tragic 13.8% |
| Alaskan Athabascans | 0.0 /100 | #315 | Tragic 13.9% |
| Spanish Americans | 0.0 /100 | #316 | Tragic 14.0% |
| Chippewa | 0.0 /100 | #317 | Tragic 14.0% |
| Paiute | 0.0 /100 | #318 | Tragic 14.0% |
| Iroquois | 0.0 /100 | #319 | Tragic 14.0% |
| Americans | 0.0 /100 | #320 | Tragic 14.1% |
| Potawatomi | 0.0 /100 | #321 | Tragic 14.1% |
| Pueblo | 0.0 /100 | #322 | Tragic 14.1% |
| Blacks/African Americans | 0.0 /100 | #323 | Tragic 14.1% |
| Natives/Alaskans | 0.0 /100 | #324 | Tragic 14.1% |
| Navajo | 0.0 /100 | #325 | Tragic 14.2% |
| Comanche | 0.0 /100 | #326 | Tragic 14.2% |
| Ottawa | 0.0 /100 | #327 | Tragic 14.2% |