Lithuanian vs Okinawan Female Disability
COMPARE
Lithuanian
Okinawan
Female Disability
Female Disability Comparison
Lithuanians
Okinawans
12.2%
FEMALE DISABILITY
59.5/ 100
METRIC RATING
166th/ 347
METRIC RANK
10.8%
FEMALE DISABILITY
100.0/ 100
METRIC RATING
16th/ 347
METRIC RANK
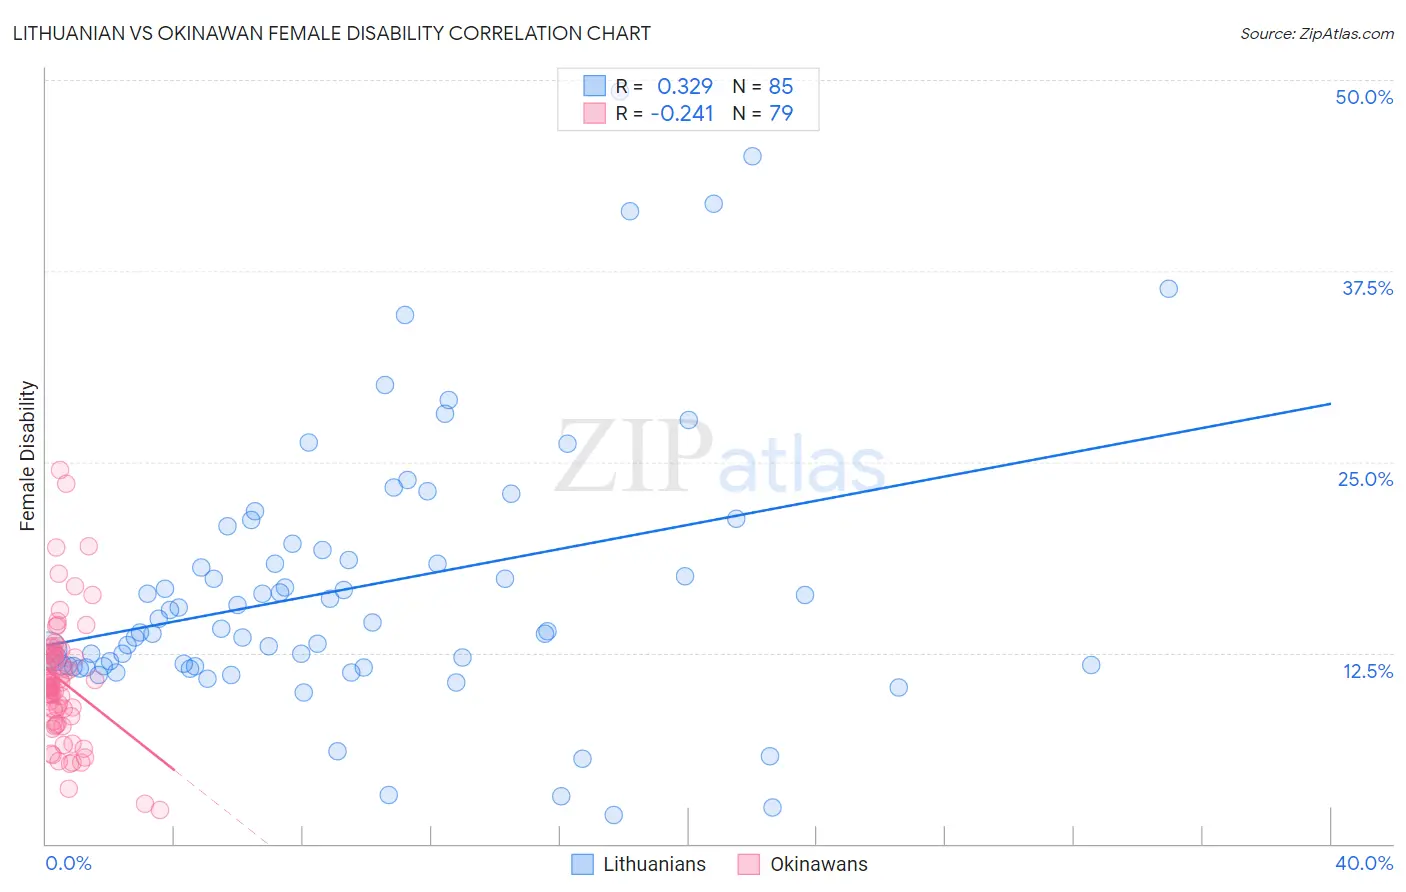
Lithuanian vs Okinawan Female Disability Correlation Chart
The statistical analysis conducted on geographies consisting of 421,926,295 people shows a mild positive correlation between the proportion of Lithuanians and percentage of females with a disability in the United States with a correlation coefficient (R) of 0.329 and weighted average of 12.2%. Similarly, the statistical analysis conducted on geographies consisting of 73,779,497 people shows a weak negative correlation between the proportion of Okinawans and percentage of females with a disability in the United States with a correlation coefficient (R) of -0.241 and weighted average of 10.8%, a difference of 13.0%.
Female Disability Correlation Summary
| Measurement | Lithuanian | Okinawan |
| Minimum | 1.9% | 2.2% |
| Maximum | 49.2% | 24.5% |
| Range | 47.3% | 22.2% |
| Mean | 16.8% | 10.6% |
| Median | 14.0% | 10.3% |
| Interquartile 25% (IQ1) | 11.6% | 8.3% |
| Interquartile 75% (IQ3) | 19.4% | 12.4% |
| Interquartile Range (IQR) | 7.8% | 4.1% |
| Standard Deviation (Sample) | 9.0% | 4.0% |
| Standard Deviation (Population) | 9.0% | 4.0% |
Similar Demographics by Female Disability
Demographics Similar to Lithuanians by Female Disability
In terms of female disability, the demographic groups most similar to Lithuanians are Immigrants from Latin America (12.2%, a difference of 0.020%), Immigrants from Haiti (12.2%, a difference of 0.030%), Lebanese (12.2%, a difference of 0.050%), Immigrants from Oceania (12.1%, a difference of 0.090%), and Maltese (12.2%, a difference of 0.10%).
| Demographics | Rating | Rank | Female Disability |
| Immigrants | Central America | 67.7 /100 | #159 | Good 12.1% |
| Immigrants | Guatemala | 66.0 /100 | #160 | Good 12.1% |
| Guyanese | 64.7 /100 | #161 | Good 12.1% |
| Immigrants | Ukraine | 64.3 /100 | #162 | Good 12.1% |
| Guatemalans | 63.8 /100 | #163 | Good 12.1% |
| Czechs | 63.6 /100 | #164 | Good 12.1% |
| Immigrants | Oceania | 61.8 /100 | #165 | Good 12.1% |
| Lithuanians | 59.5 /100 | #166 | Average 12.2% |
| Immigrants | Latin America | 59.0 /100 | #167 | Average 12.2% |
| Immigrants | Haiti | 58.8 /100 | #168 | Average 12.2% |
| Lebanese | 58.1 /100 | #169 | Average 12.2% |
| Maltese | 57.0 /100 | #170 | Average 12.2% |
| Immigrants | Southern Europe | 56.3 /100 | #171 | Average 12.2% |
| Haitians | 51.9 /100 | #172 | Average 12.2% |
| Immigrants | Mexico | 50.8 /100 | #173 | Average 12.2% |
Demographics Similar to Okinawans by Female Disability
In terms of female disability, the demographic groups most similar to Okinawans are Burmese (10.7%, a difference of 0.070%), Indian (Asian) (10.8%, a difference of 0.32%), Immigrants from China (10.7%, a difference of 0.58%), Immigrants from Eastern Asia (10.7%, a difference of 0.61%), and Immigrants from Israel (10.7%, a difference of 0.69%).
| Demographics | Rating | Rank | Female Disability |
| Iranians | 100.0 /100 | #9 | Exceptional 10.6% |
| Immigrants | Hong Kong | 100.0 /100 | #10 | Exceptional 10.6% |
| Immigrants | Korea | 100.0 /100 | #11 | Exceptional 10.6% |
| Immigrants | Israel | 100.0 /100 | #12 | Exceptional 10.7% |
| Immigrants | Eastern Asia | 100.0 /100 | #13 | Exceptional 10.7% |
| Immigrants | China | 100.0 /100 | #14 | Exceptional 10.7% |
| Burmese | 100.0 /100 | #15 | Exceptional 10.7% |
| Okinawans | 100.0 /100 | #16 | Exceptional 10.8% |
| Indians (Asian) | 100.0 /100 | #17 | Exceptional 10.8% |
| Immigrants | Iran | 100.0 /100 | #18 | Exceptional 10.8% |
| Immigrants | Venezuela | 100.0 /100 | #19 | Exceptional 10.9% |
| Immigrants | Pakistan | 100.0 /100 | #20 | Exceptional 10.9% |
| Asians | 100.0 /100 | #21 | Exceptional 10.9% |
| Immigrants | Sri Lanka | 100.0 /100 | #22 | Exceptional 10.9% |
| Venezuelans | 100.0 /100 | #23 | Exceptional 11.0% |