Romanian vs Immigrants from Austria Female Disability
COMPARE
Romanian
Immigrants from Austria
Female Disability
Female Disability Comparison
Romanians
Immigrants from Austria
11.9%
FEMALE DISABILITY
91.6/ 100
METRIC RATING
140th/ 347
METRIC RANK
12.0%
FEMALE DISABILITY
87.9/ 100
METRIC RATING
144th/ 347
METRIC RANK
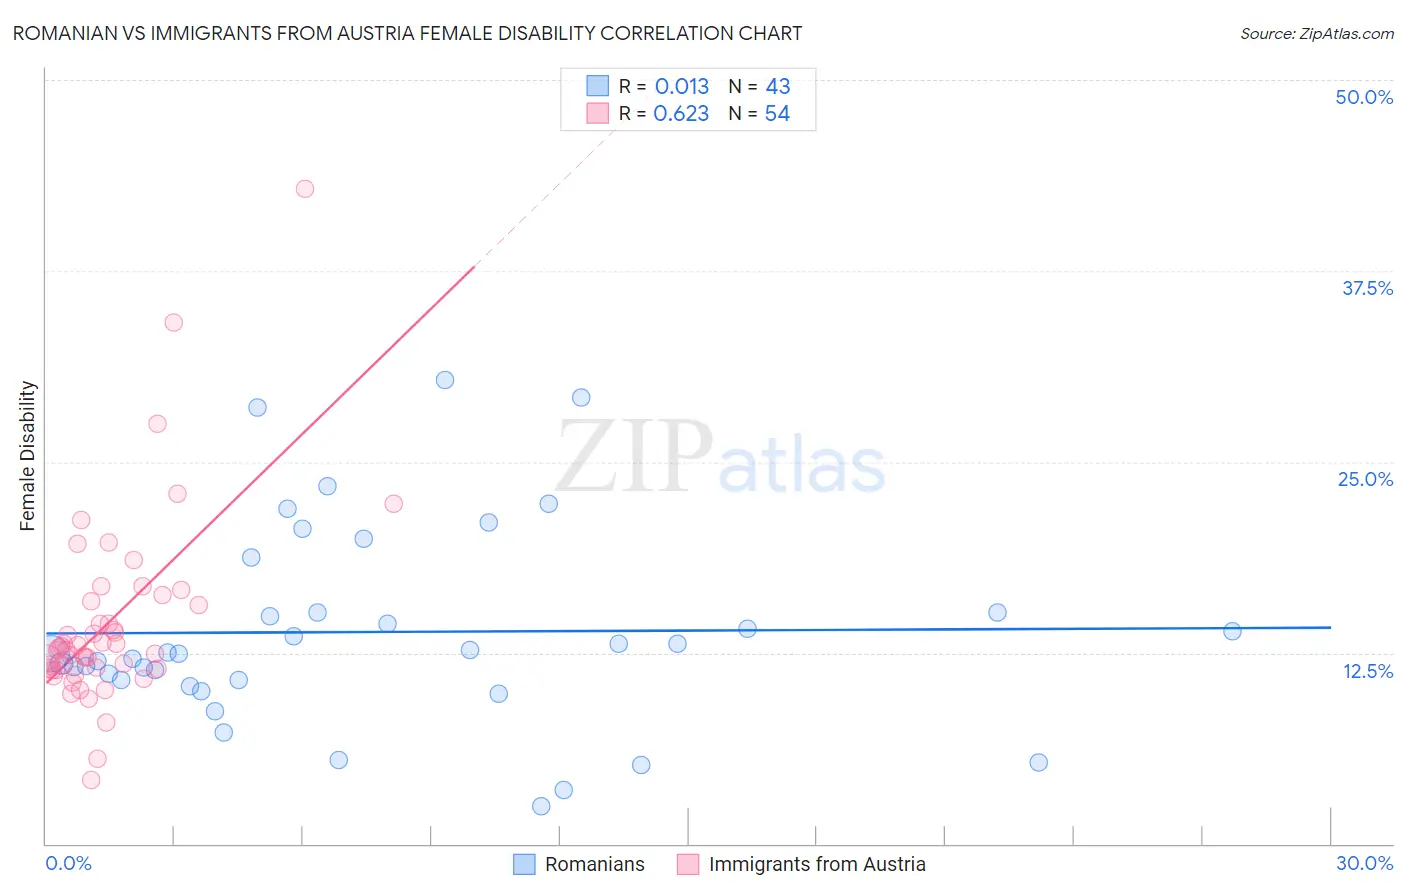
Romanian vs Immigrants from Austria Female Disability Correlation Chart
The statistical analysis conducted on geographies consisting of 377,864,949 people shows no correlation between the proportion of Romanians and percentage of females with a disability in the United States with a correlation coefficient (R) of 0.013 and weighted average of 11.9%. Similarly, the statistical analysis conducted on geographies consisting of 167,970,521 people shows a significant positive correlation between the proportion of Immigrants from Austria and percentage of females with a disability in the United States with a correlation coefficient (R) of 0.623 and weighted average of 12.0%, a difference of 0.40%.
Female Disability Correlation Summary
| Measurement | Romanian | Immigrants from Austria |
| Minimum | 2.4% | 4.2% |
| Maximum | 30.3% | 42.9% |
| Range | 27.9% | 38.7% |
| Mean | 13.9% | 14.5% |
| Median | 12.5% | 12.8% |
| Interquartile 25% (IQ1) | 10.7% | 11.5% |
| Interquartile 75% (IQ3) | 15.2% | 15.9% |
| Interquartile Range (IQR) | 4.4% | 4.4% |
| Standard Deviation (Sample) | 6.5% | 6.3% |
| Standard Deviation (Population) | 6.4% | 6.3% |
Demographics Similar to Romanians and Immigrants from Austria by Female Disability
In terms of female disability, the demographic groups most similar to Romanians are Immigrants from Ecuador (11.9%, a difference of 0.020%), Immigrants from Hungary (11.9%, a difference of 0.16%), Immigrants from Africa (11.9%, a difference of 0.19%), Immigrants from Sudan (11.9%, a difference of 0.23%), and Ecuadorian (11.9%, a difference of 0.25%). Similarly, the demographic groups most similar to Immigrants from Austria are Estonian (12.0%, a difference of 0.0%), Immigrants from Sudan (11.9%, a difference of 0.17%), Immigrants from Africa (11.9%, a difference of 0.21%), Pakistani (12.0%, a difference of 0.27%), and Nigerian (12.0%, a difference of 0.30%).
| Demographics | Rating | Rank | Female Disability |
| Immigrants | Syria | 94.6 /100 | #132 | Exceptional 11.9% |
| Kenyans | 94.5 /100 | #133 | Exceptional 11.9% |
| Immigrants | Nicaragua | 94.5 /100 | #134 | Exceptional 11.9% |
| Central Americans | 94.2 /100 | #135 | Exceptional 11.9% |
| Ugandans | 94.0 /100 | #136 | Exceptional 11.9% |
| Immigrants | Norway | 93.8 /100 | #137 | Exceptional 11.9% |
| Ecuadorians | 93.4 /100 | #138 | Exceptional 11.9% |
| Immigrants | Hungary | 92.8 /100 | #139 | Exceptional 11.9% |
| Romanians | 91.6 /100 | #140 | Exceptional 11.9% |
| Immigrants | Ecuador | 91.5 /100 | #141 | Exceptional 11.9% |
| Immigrants | Africa | 90.0 /100 | #142 | Excellent 11.9% |
| Immigrants | Sudan | 89.6 /100 | #143 | Excellent 11.9% |
| Immigrants | Austria | 87.9 /100 | #144 | Excellent 12.0% |
| Estonians | 87.8 /100 | #145 | Excellent 12.0% |
| Pakistanis | 84.6 /100 | #146 | Excellent 12.0% |
| Nigerians | 84.0 /100 | #147 | Excellent 12.0% |
| Immigrants | Kenya | 83.1 /100 | #148 | Excellent 12.0% |
| Greeks | 82.0 /100 | #149 | Excellent 12.0% |
| Immigrants | Moldova | 81.4 /100 | #150 | Excellent 12.0% |
| Icelanders | 80.7 /100 | #151 | Excellent 12.0% |
| Immigrants | Scotland | 79.3 /100 | #152 | Good 12.0% |