Lithuanian vs Immigrants from Croatia Female Disability
COMPARE
Lithuanian
Immigrants from Croatia
Female Disability
Female Disability Comparison
Lithuanians
Immigrants from Croatia
12.2%
FEMALE DISABILITY
59.5/ 100
METRIC RATING
166th/ 347
METRIC RANK
11.8%
FEMALE DISABILITY
96.7/ 100
METRIC RATING
123rd/ 347
METRIC RANK
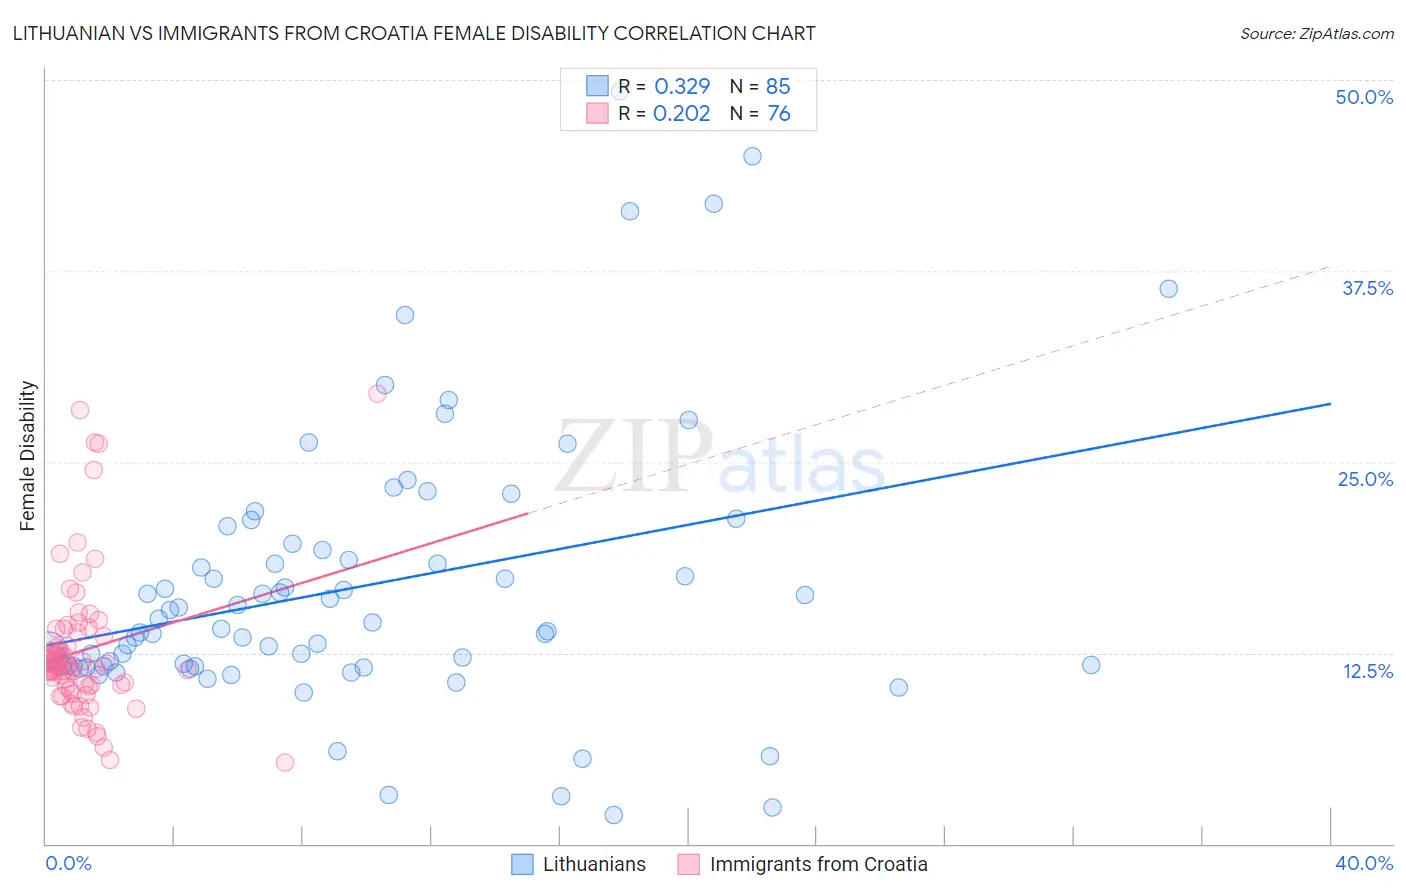
Lithuanian vs Immigrants from Croatia Female Disability Correlation Chart
The statistical analysis conducted on geographies consisting of 421,926,295 people shows a mild positive correlation between the proportion of Lithuanians and percentage of females with a disability in the United States with a correlation coefficient (R) of 0.329 and weighted average of 12.2%. Similarly, the statistical analysis conducted on geographies consisting of 132,577,036 people shows a weak positive correlation between the proportion of Immigrants from Croatia and percentage of females with a disability in the United States with a correlation coefficient (R) of 0.202 and weighted average of 11.8%, a difference of 2.9%.
Female Disability Correlation Summary
| Measurement | Lithuanian | Immigrants from Croatia |
| Minimum | 1.9% | 5.3% |
| Maximum | 49.2% | 29.4% |
| Range | 47.3% | 24.1% |
| Mean | 16.8% | 12.7% |
| Median | 14.0% | 11.6% |
| Interquartile 25% (IQ1) | 11.6% | 10.3% |
| Interquartile 75% (IQ3) | 19.4% | 13.9% |
| Interquartile Range (IQR) | 7.8% | 3.6% |
| Standard Deviation (Sample) | 9.0% | 4.8% |
| Standard Deviation (Population) | 9.0% | 4.7% |
Similar Demographics by Female Disability
Demographics Similar to Lithuanians by Female Disability
In terms of female disability, the demographic groups most similar to Lithuanians are Immigrants from Latin America (12.2%, a difference of 0.020%), Immigrants from Haiti (12.2%, a difference of 0.030%), Lebanese (12.2%, a difference of 0.050%), Immigrants from Oceania (12.1%, a difference of 0.090%), and Maltese (12.2%, a difference of 0.10%).
| Demographics | Rating | Rank | Female Disability |
| Immigrants | Central America | 67.7 /100 | #159 | Good 12.1% |
| Immigrants | Guatemala | 66.0 /100 | #160 | Good 12.1% |
| Guyanese | 64.7 /100 | #161 | Good 12.1% |
| Immigrants | Ukraine | 64.3 /100 | #162 | Good 12.1% |
| Guatemalans | 63.8 /100 | #163 | Good 12.1% |
| Czechs | 63.6 /100 | #164 | Good 12.1% |
| Immigrants | Oceania | 61.8 /100 | #165 | Good 12.1% |
| Lithuanians | 59.5 /100 | #166 | Average 12.2% |
| Immigrants | Latin America | 59.0 /100 | #167 | Average 12.2% |
| Immigrants | Haiti | 58.8 /100 | #168 | Average 12.2% |
| Lebanese | 58.1 /100 | #169 | Average 12.2% |
| Maltese | 57.0 /100 | #170 | Average 12.2% |
| Immigrants | Southern Europe | 56.3 /100 | #171 | Average 12.2% |
| Haitians | 51.9 /100 | #172 | Average 12.2% |
| Immigrants | Mexico | 50.8 /100 | #173 | Average 12.2% |
Demographics Similar to Immigrants from Croatia by Female Disability
In terms of female disability, the demographic groups most similar to Immigrants from Croatia are Immigrants from North Macedonia (11.8%, a difference of 0.050%), Russian (11.8%, a difference of 0.050%), Immigrants from Netherlands (11.8%, a difference of 0.060%), Immigrants from Italy (11.8%, a difference of 0.070%), and Immigrants from Kazakhstan (11.8%, a difference of 0.090%).
| Demographics | Rating | Rank | Female Disability |
| Immigrants | Morocco | 97.6 /100 | #116 | Exceptional 11.8% |
| Immigrants | Eastern Europe | 97.2 /100 | #117 | Exceptional 11.8% |
| Immigrants | Nigeria | 97.2 /100 | #118 | Exceptional 11.8% |
| Immigrants | Uganda | 97.2 /100 | #119 | Exceptional 11.8% |
| Immigrants | Kazakhstan | 97.0 /100 | #120 | Exceptional 11.8% |
| Immigrants | Netherlands | 96.9 /100 | #121 | Exceptional 11.8% |
| Immigrants | North Macedonia | 96.8 /100 | #122 | Exceptional 11.8% |
| Immigrants | Croatia | 96.7 /100 | #123 | Exceptional 11.8% |
| Russians | 96.5 /100 | #124 | Exceptional 11.8% |
| Immigrants | Italy | 96.4 /100 | #125 | Exceptional 11.8% |
| Immigrants | Europe | 96.2 /100 | #126 | Exceptional 11.8% |
| South American Indians | 95.8 /100 | #127 | Exceptional 11.8% |
| Immigrants | Latvia | 95.6 /100 | #128 | Exceptional 11.8% |
| Macedonians | 95.5 /100 | #129 | Exceptional 11.8% |
| Nicaraguans | 95.2 /100 | #130 | Exceptional 11.9% |