Lithuanian vs African Female Disability
COMPARE
Lithuanian
African
Female Disability
Female Disability Comparison
Lithuanians
Africans
12.2%
FEMALE DISABILITY
59.5/ 100
METRIC RATING
166th/ 347
METRIC RANK
13.4%
FEMALE DISABILITY
0.0/ 100
METRIC RATING
301st/ 347
METRIC RANK
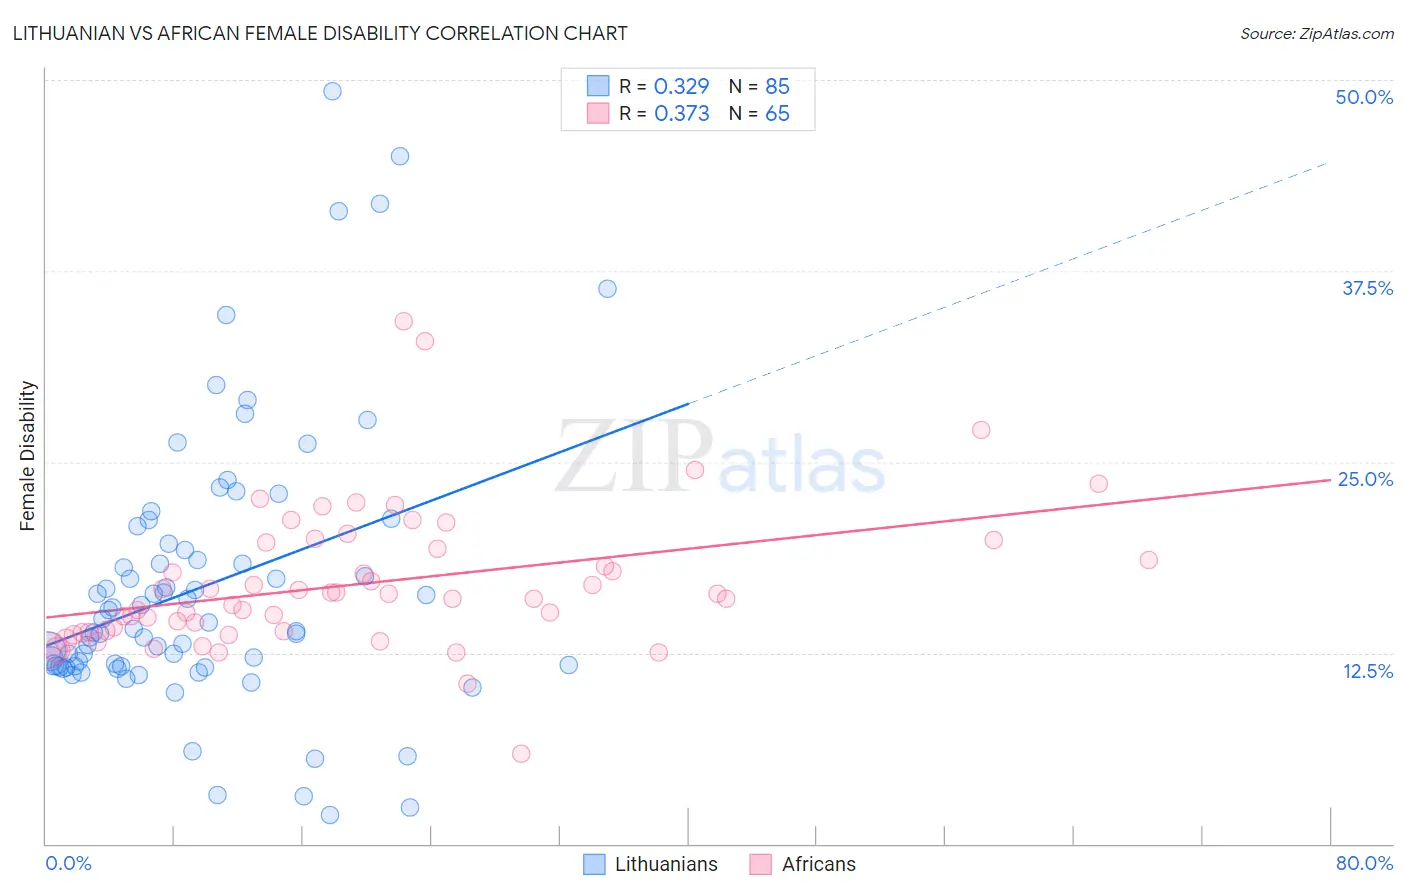
Lithuanian vs African Female Disability Correlation Chart
The statistical analysis conducted on geographies consisting of 421,926,295 people shows a mild positive correlation between the proportion of Lithuanians and percentage of females with a disability in the United States with a correlation coefficient (R) of 0.329 and weighted average of 12.2%. Similarly, the statistical analysis conducted on geographies consisting of 469,943,278 people shows a mild positive correlation between the proportion of Africans and percentage of females with a disability in the United States with a correlation coefficient (R) of 0.373 and weighted average of 13.4%, a difference of 10.5%.
Female Disability Correlation Summary
| Measurement | Lithuanian | African |
| Minimum | 1.9% | 5.9% |
| Maximum | 49.2% | 34.2% |
| Range | 47.3% | 28.4% |
| Mean | 16.8% | 17.0% |
| Median | 14.0% | 16.1% |
| Interquartile 25% (IQ1) | 11.6% | 13.9% |
| Interquartile 75% (IQ3) | 19.4% | 19.5% |
| Interquartile Range (IQR) | 7.8% | 5.6% |
| Standard Deviation (Sample) | 9.0% | 4.7% |
| Standard Deviation (Population) | 9.0% | 4.7% |
Similar Demographics by Female Disability
Demographics Similar to Lithuanians by Female Disability
In terms of female disability, the demographic groups most similar to Lithuanians are Immigrants from Latin America (12.2%, a difference of 0.020%), Immigrants from Haiti (12.2%, a difference of 0.030%), Lebanese (12.2%, a difference of 0.050%), Immigrants from Oceania (12.1%, a difference of 0.090%), and Maltese (12.2%, a difference of 0.10%).
| Demographics | Rating | Rank | Female Disability |
| Immigrants | Central America | 67.7 /100 | #159 | Good 12.1% |
| Immigrants | Guatemala | 66.0 /100 | #160 | Good 12.1% |
| Guyanese | 64.7 /100 | #161 | Good 12.1% |
| Immigrants | Ukraine | 64.3 /100 | #162 | Good 12.1% |
| Guatemalans | 63.8 /100 | #163 | Good 12.1% |
| Czechs | 63.6 /100 | #164 | Good 12.1% |
| Immigrants | Oceania | 61.8 /100 | #165 | Good 12.1% |
| Lithuanians | 59.5 /100 | #166 | Average 12.2% |
| Immigrants | Latin America | 59.0 /100 | #167 | Average 12.2% |
| Immigrants | Haiti | 58.8 /100 | #168 | Average 12.2% |
| Lebanese | 58.1 /100 | #169 | Average 12.2% |
| Maltese | 57.0 /100 | #170 | Average 12.2% |
| Immigrants | Southern Europe | 56.3 /100 | #171 | Average 12.2% |
| Haitians | 51.9 /100 | #172 | Average 12.2% |
| Immigrants | Mexico | 50.8 /100 | #173 | Average 12.2% |
Demographics Similar to Africans by Female Disability
In terms of female disability, the demographic groups most similar to Africans are Scotch-Irish (13.4%, a difference of 0.14%), Immigrants from Portugal (13.5%, a difference of 0.14%), Immigrants from Micronesia (13.5%, a difference of 0.17%), Pennsylvania German (13.4%, a difference of 0.20%), and Immigrants from Dominican Republic (13.4%, a difference of 0.21%).
| Demographics | Rating | Rank | Female Disability |
| Celtics | 0.0 /100 | #294 | Tragic 13.3% |
| French | 0.0 /100 | #295 | Tragic 13.3% |
| Nepalese | 0.0 /100 | #296 | Tragic 13.3% |
| Slovaks | 0.0 /100 | #297 | Tragic 13.3% |
| Immigrants | Nonimmigrants | 0.0 /100 | #298 | Tragic 13.4% |
| Immigrants | Dominican Republic | 0.0 /100 | #299 | Tragic 13.4% |
| Pennsylvania Germans | 0.0 /100 | #300 | Tragic 13.4% |
| Africans | 0.0 /100 | #301 | Tragic 13.4% |
| Scotch-Irish | 0.0 /100 | #302 | Tragic 13.4% |
| Immigrants | Portugal | 0.0 /100 | #303 | Tragic 13.5% |
| Immigrants | Micronesia | 0.0 /100 | #304 | Tragic 13.5% |
| Dominicans | 0.0 /100 | #305 | Tragic 13.5% |
| French Canadians | 0.0 /100 | #306 | Tragic 13.6% |
| Central American Indians | 0.0 /100 | #307 | Tragic 13.6% |
| Cree | 0.0 /100 | #308 | Tragic 13.7% |