Lithuanian vs Palestinian Female Disability
COMPARE
Lithuanian
Palestinian
Female Disability
Female Disability Comparison
Lithuanians
Palestinians
12.2%
FEMALE DISABILITY
59.5/ 100
METRIC RATING
166th/ 347
METRIC RANK
11.6%
FEMALE DISABILITY
99.6/ 100
METRIC RATING
85th/ 347
METRIC RANK
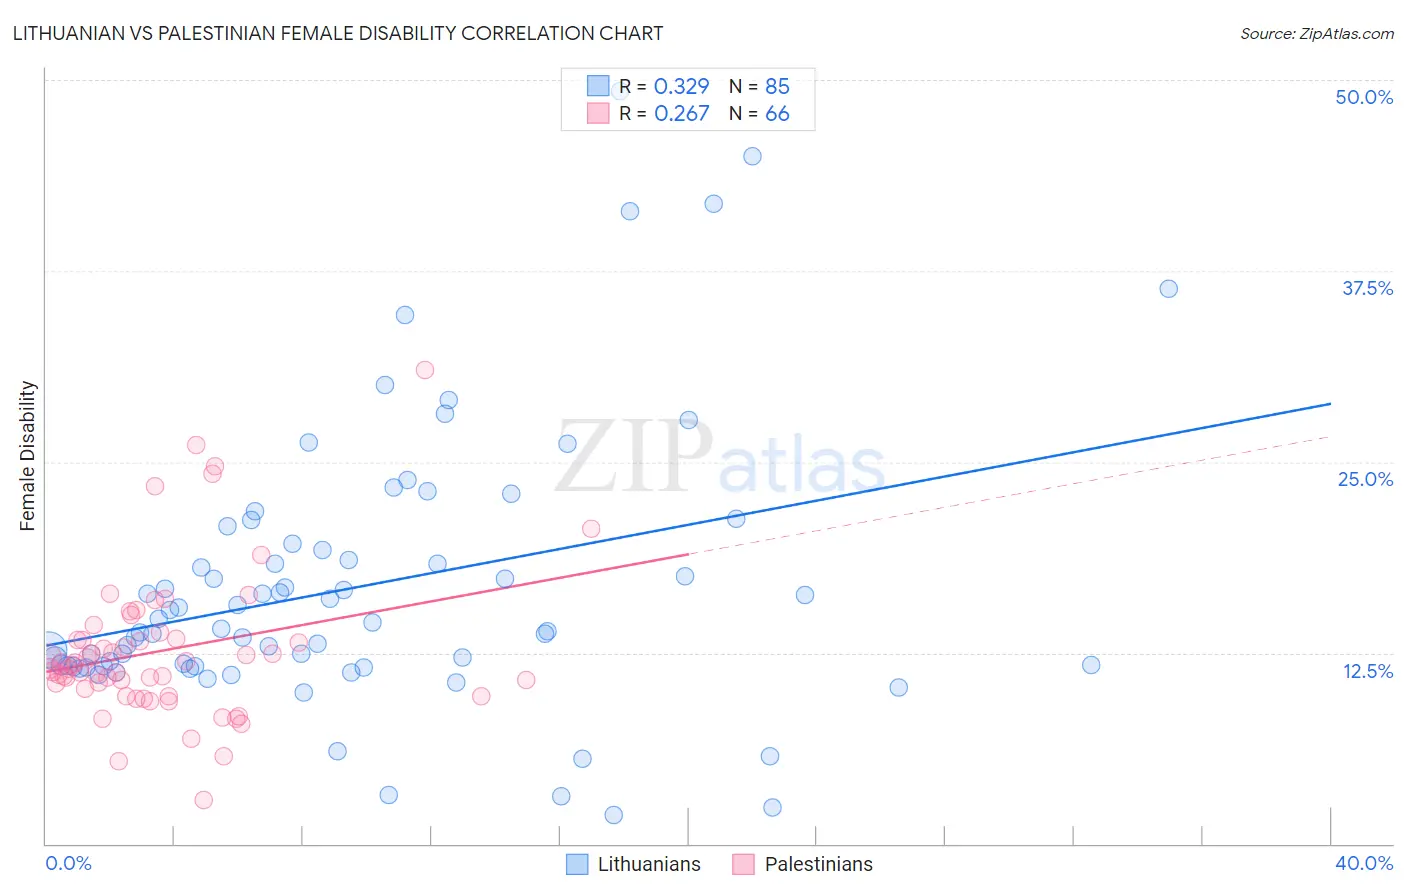
Lithuanian vs Palestinian Female Disability Correlation Chart
The statistical analysis conducted on geographies consisting of 421,926,295 people shows a mild positive correlation between the proportion of Lithuanians and percentage of females with a disability in the United States with a correlation coefficient (R) of 0.329 and weighted average of 12.2%. Similarly, the statistical analysis conducted on geographies consisting of 216,463,404 people shows a weak positive correlation between the proportion of Palestinians and percentage of females with a disability in the United States with a correlation coefficient (R) of 0.267 and weighted average of 11.6%, a difference of 5.0%.
Female Disability Correlation Summary
| Measurement | Lithuanian | Palestinian |
| Minimum | 1.9% | 2.8% |
| Maximum | 49.2% | 31.0% |
| Range | 47.3% | 28.2% |
| Mean | 16.8% | 12.7% |
| Median | 14.0% | 11.6% |
| Interquartile 25% (IQ1) | 11.6% | 10.1% |
| Interquartile 75% (IQ3) | 19.4% | 13.4% |
| Interquartile Range (IQR) | 7.8% | 3.3% |
| Standard Deviation (Sample) | 9.0% | 4.9% |
| Standard Deviation (Population) | 9.0% | 4.8% |
Similar Demographics by Female Disability
Demographics Similar to Lithuanians by Female Disability
In terms of female disability, the demographic groups most similar to Lithuanians are Immigrants from Latin America (12.2%, a difference of 0.020%), Immigrants from Haiti (12.2%, a difference of 0.030%), Lebanese (12.2%, a difference of 0.050%), Immigrants from Oceania (12.1%, a difference of 0.090%), and Maltese (12.2%, a difference of 0.10%).
| Demographics | Rating | Rank | Female Disability |
| Immigrants | Central America | 67.7 /100 | #159 | Good 12.1% |
| Immigrants | Guatemala | 66.0 /100 | #160 | Good 12.1% |
| Guyanese | 64.7 /100 | #161 | Good 12.1% |
| Immigrants | Ukraine | 64.3 /100 | #162 | Good 12.1% |
| Guatemalans | 63.8 /100 | #163 | Good 12.1% |
| Czechs | 63.6 /100 | #164 | Good 12.1% |
| Immigrants | Oceania | 61.8 /100 | #165 | Good 12.1% |
| Lithuanians | 59.5 /100 | #166 | Average 12.2% |
| Immigrants | Latin America | 59.0 /100 | #167 | Average 12.2% |
| Immigrants | Haiti | 58.8 /100 | #168 | Average 12.2% |
| Lebanese | 58.1 /100 | #169 | Average 12.2% |
| Maltese | 57.0 /100 | #170 | Average 12.2% |
| Immigrants | Southern Europe | 56.3 /100 | #171 | Average 12.2% |
| Haitians | 51.9 /100 | #172 | Average 12.2% |
| Immigrants | Mexico | 50.8 /100 | #173 | Average 12.2% |
Demographics Similar to Palestinians by Female Disability
In terms of female disability, the demographic groups most similar to Palestinians are Immigrants from Cameroon (11.6%, a difference of 0.0%), Immigrants from Poland (11.6%, a difference of 0.030%), Immigrants from Serbia (11.6%, a difference of 0.060%), Immigrants from Denmark (11.6%, a difference of 0.070%), and Yup'ik (11.6%, a difference of 0.070%).
| Demographics | Rating | Rank | Female Disability |
| Immigrants | South Africa | 99.7 /100 | #78 | Exceptional 11.5% |
| Sierra Leoneans | 99.7 /100 | #79 | Exceptional 11.5% |
| Immigrants | Jordan | 99.7 /100 | #80 | Exceptional 11.5% |
| Eastern Europeans | 99.7 /100 | #81 | Exceptional 11.5% |
| Luxembourgers | 99.6 /100 | #82 | Exceptional 11.6% |
| Immigrants | Serbia | 99.6 /100 | #83 | Exceptional 11.6% |
| Immigrants | Poland | 99.6 /100 | #84 | Exceptional 11.6% |
| Palestinians | 99.6 /100 | #85 | Exceptional 11.6% |
| Immigrants | Cameroon | 99.6 /100 | #86 | Exceptional 11.6% |
| Immigrants | Denmark | 99.5 /100 | #87 | Exceptional 11.6% |
| Yup'ik | 99.5 /100 | #88 | Exceptional 11.6% |
| Vietnamese | 99.5 /100 | #89 | Exceptional 11.6% |
| Immigrants | Romania | 99.5 /100 | #90 | Exceptional 11.6% |
| Immigrants | Zimbabwe | 99.5 /100 | #91 | Exceptional 11.6% |
| Immigrants | Czechoslovakia | 99.5 /100 | #92 | Exceptional 11.6% |