Guyanese vs Immigrants from Austria Female Disability
COMPARE
Guyanese
Immigrants from Austria
Female Disability
Female Disability Comparison
Guyanese
Immigrants from Austria
12.1%
FEMALE DISABILITY
64.7/ 100
METRIC RATING
161st/ 347
METRIC RANK
12.0%
FEMALE DISABILITY
87.9/ 100
METRIC RATING
144th/ 347
METRIC RANK
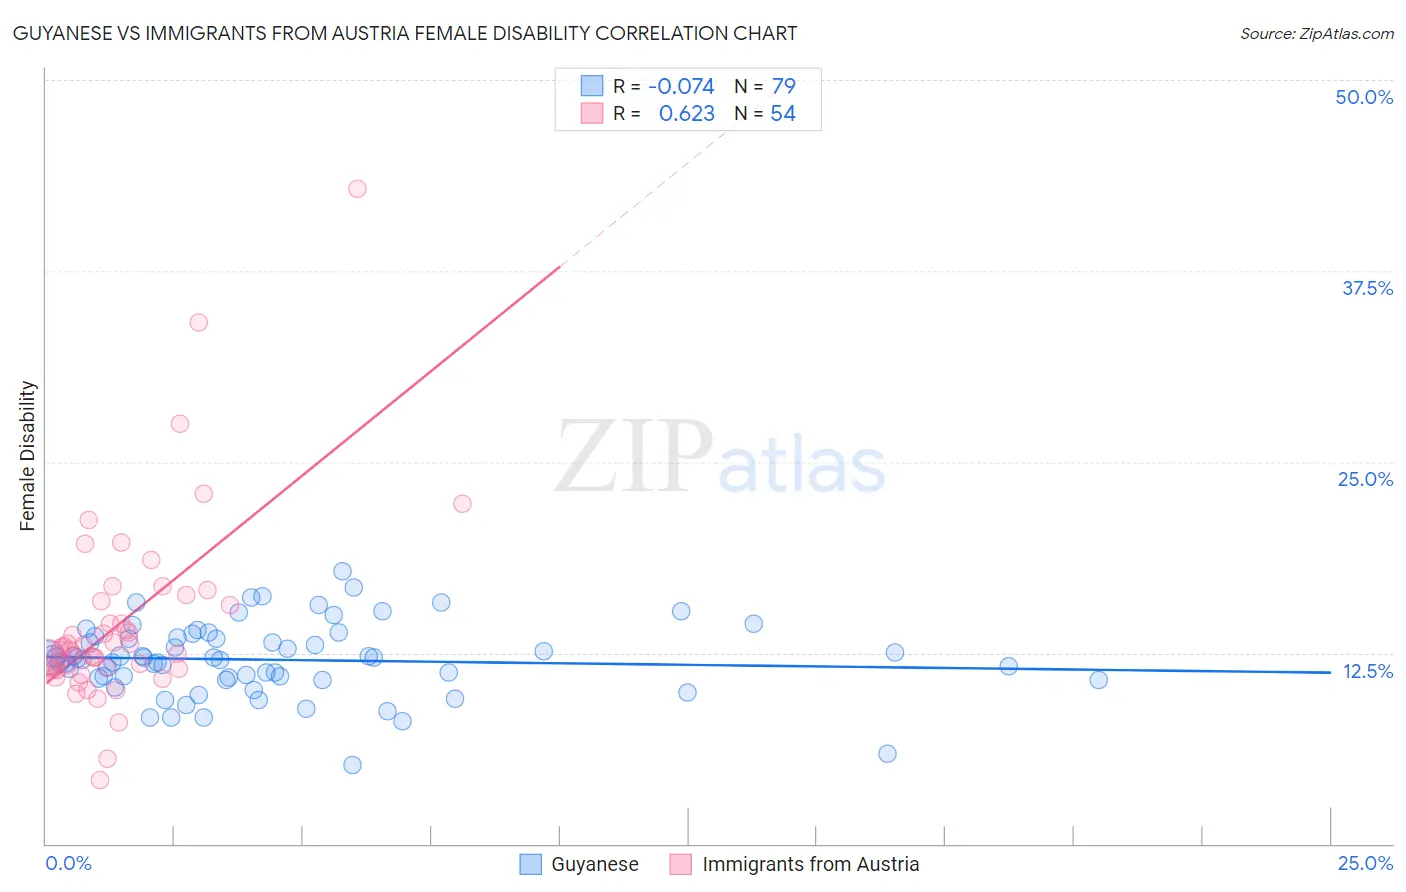
Guyanese vs Immigrants from Austria Female Disability Correlation Chart
The statistical analysis conducted on geographies consisting of 176,903,596 people shows a slight negative correlation between the proportion of Guyanese and percentage of females with a disability in the United States with a correlation coefficient (R) of -0.074 and weighted average of 12.1%. Similarly, the statistical analysis conducted on geographies consisting of 167,970,521 people shows a significant positive correlation between the proportion of Immigrants from Austria and percentage of females with a disability in the United States with a correlation coefficient (R) of 0.623 and weighted average of 12.0%, a difference of 1.3%.
Female Disability Correlation Summary
| Measurement | Guyanese | Immigrants from Austria |
| Minimum | 5.2% | 4.2% |
| Maximum | 17.8% | 42.9% |
| Range | 12.6% | 38.7% |
| Mean | 12.0% | 14.5% |
| Median | 12.2% | 12.8% |
| Interquartile 25% (IQ1) | 10.8% | 11.5% |
| Interquartile 75% (IQ3) | 13.5% | 15.9% |
| Interquartile Range (IQR) | 2.7% | 4.4% |
| Standard Deviation (Sample) | 2.4% | 6.3% |
| Standard Deviation (Population) | 2.4% | 6.3% |
Demographics Similar to Guyanese and Immigrants from Austria by Female Disability
In terms of female disability, the demographic groups most similar to Guyanese are Immigrants from Ukraine (12.1%, a difference of 0.010%), Immigrants from Guatemala (12.1%, a difference of 0.060%), Immigrants from Central America (12.1%, a difference of 0.13%), Immigrants from Middle Africa (12.1%, a difference of 0.34%), and Danish (12.1%, a difference of 0.35%). Similarly, the demographic groups most similar to Immigrants from Austria are Estonian (12.0%, a difference of 0.0%), Immigrants from Sudan (11.9%, a difference of 0.17%), Immigrants from Africa (11.9%, a difference of 0.21%), Pakistani (12.0%, a difference of 0.27%), and Nigerian (12.0%, a difference of 0.30%).
| Demographics | Rating | Rank | Female Disability |
| Immigrants | Africa | 90.0 /100 | #142 | Excellent 11.9% |
| Immigrants | Sudan | 89.6 /100 | #143 | Excellent 11.9% |
| Immigrants | Austria | 87.9 /100 | #144 | Excellent 12.0% |
| Estonians | 87.8 /100 | #145 | Excellent 12.0% |
| Pakistanis | 84.6 /100 | #146 | Excellent 12.0% |
| Nigerians | 84.0 /100 | #147 | Excellent 12.0% |
| Immigrants | Kenya | 83.1 /100 | #148 | Excellent 12.0% |
| Greeks | 82.0 /100 | #149 | Excellent 12.0% |
| Immigrants | Moldova | 81.4 /100 | #150 | Excellent 12.0% |
| Icelanders | 80.7 /100 | #151 | Excellent 12.0% |
| Immigrants | Scotland | 79.3 /100 | #152 | Good 12.0% |
| Sudanese | 79.1 /100 | #153 | Good 12.0% |
| Syrians | 76.9 /100 | #154 | Good 12.1% |
| Ghanaians | 76.6 /100 | #155 | Good 12.1% |
| Moroccans | 72.9 /100 | #156 | Good 12.1% |
| Danes | 72.5 /100 | #157 | Good 12.1% |
| Immigrants | Middle Africa | 72.4 /100 | #158 | Good 12.1% |
| Immigrants | Central America | 67.7 /100 | #159 | Good 12.1% |
| Immigrants | Guatemala | 66.0 /100 | #160 | Good 12.1% |
| Guyanese | 64.7 /100 | #161 | Good 12.1% |
| Immigrants | Ukraine | 64.3 /100 | #162 | Good 12.1% |