Lithuanian vs Cambodian Female Disability
COMPARE
Lithuanian
Cambodian
Female Disability
Female Disability Comparison
Lithuanians
Cambodians
12.2%
FEMALE DISABILITY
59.5/ 100
METRIC RATING
166th/ 347
METRIC RANK
11.3%
FEMALE DISABILITY
100.0/ 100
METRIC RATING
44th/ 347
METRIC RANK
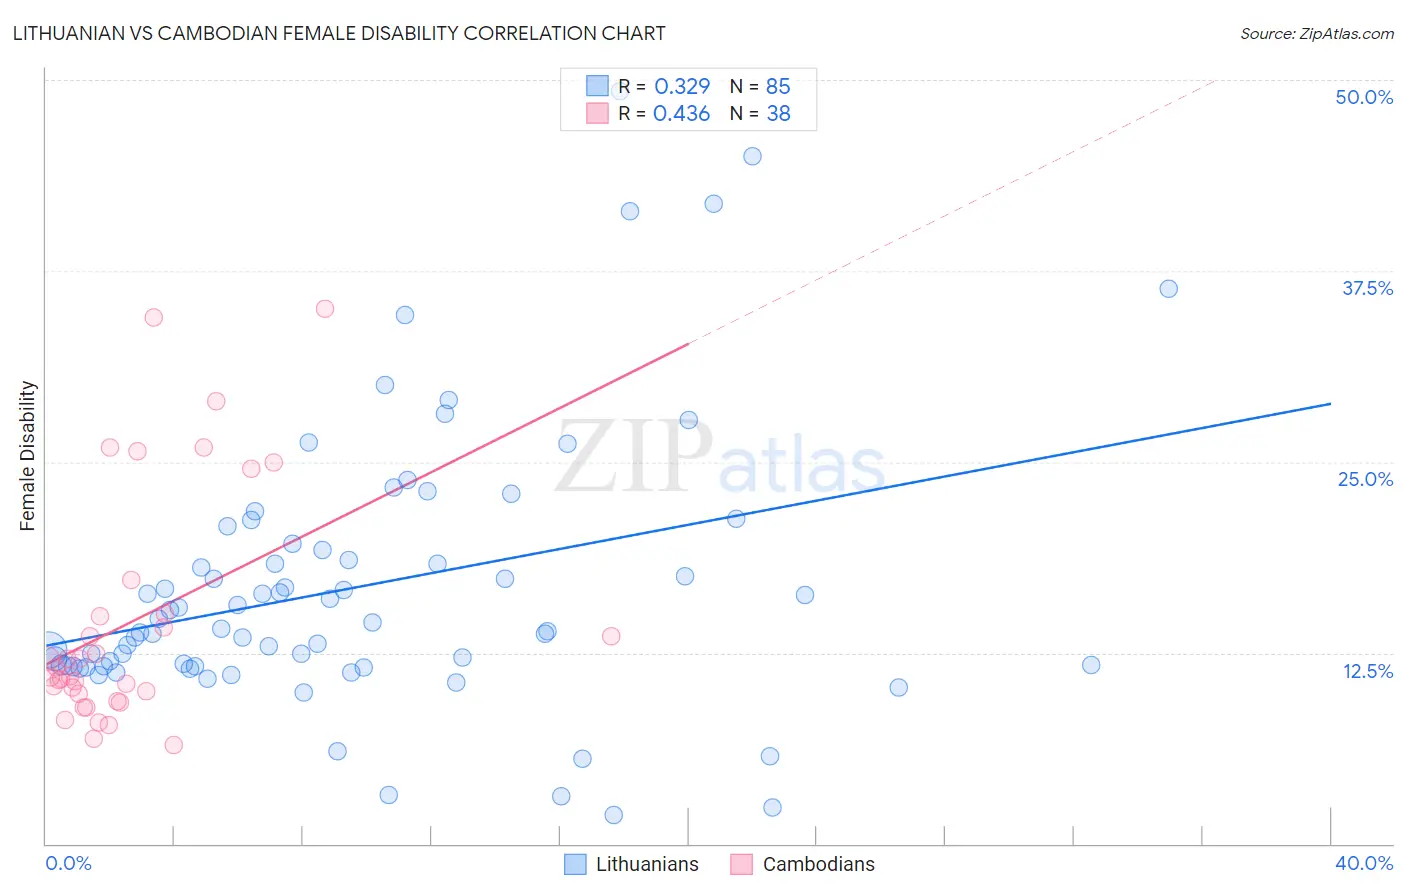
Lithuanian vs Cambodian Female Disability Correlation Chart
The statistical analysis conducted on geographies consisting of 421,926,295 people shows a mild positive correlation between the proportion of Lithuanians and percentage of females with a disability in the United States with a correlation coefficient (R) of 0.329 and weighted average of 12.2%. Similarly, the statistical analysis conducted on geographies consisting of 102,507,228 people shows a moderate positive correlation between the proportion of Cambodians and percentage of females with a disability in the United States with a correlation coefficient (R) of 0.436 and weighted average of 11.3%, a difference of 7.9%.
Female Disability Correlation Summary
| Measurement | Lithuanian | Cambodian |
| Minimum | 1.9% | 6.5% |
| Maximum | 49.2% | 35.1% |
| Range | 47.3% | 28.6% |
| Mean | 16.8% | 14.5% |
| Median | 14.0% | 11.2% |
| Interquartile 25% (IQ1) | 11.6% | 9.9% |
| Interquartile 75% (IQ3) | 19.4% | 15.1% |
| Interquartile Range (IQR) | 7.8% | 5.2% |
| Standard Deviation (Sample) | 9.0% | 7.7% |
| Standard Deviation (Population) | 9.0% | 7.6% |
Similar Demographics by Female Disability
Demographics Similar to Lithuanians by Female Disability
In terms of female disability, the demographic groups most similar to Lithuanians are Immigrants from Latin America (12.2%, a difference of 0.020%), Immigrants from Haiti (12.2%, a difference of 0.030%), Lebanese (12.2%, a difference of 0.050%), Immigrants from Oceania (12.1%, a difference of 0.090%), and Maltese (12.2%, a difference of 0.10%).
| Demographics | Rating | Rank | Female Disability |
| Immigrants | Central America | 67.7 /100 | #159 | Good 12.1% |
| Immigrants | Guatemala | 66.0 /100 | #160 | Good 12.1% |
| Guyanese | 64.7 /100 | #161 | Good 12.1% |
| Immigrants | Ukraine | 64.3 /100 | #162 | Good 12.1% |
| Guatemalans | 63.8 /100 | #163 | Good 12.1% |
| Czechs | 63.6 /100 | #164 | Good 12.1% |
| Immigrants | Oceania | 61.8 /100 | #165 | Good 12.1% |
| Lithuanians | 59.5 /100 | #166 | Average 12.2% |
| Immigrants | Latin America | 59.0 /100 | #167 | Average 12.2% |
| Immigrants | Haiti | 58.8 /100 | #168 | Average 12.2% |
| Lebanese | 58.1 /100 | #169 | Average 12.2% |
| Maltese | 57.0 /100 | #170 | Average 12.2% |
| Immigrants | Southern Europe | 56.3 /100 | #171 | Average 12.2% |
| Haitians | 51.9 /100 | #172 | Average 12.2% |
| Immigrants | Mexico | 50.8 /100 | #173 | Average 12.2% |
Demographics Similar to Cambodians by Female Disability
In terms of female disability, the demographic groups most similar to Cambodians are Immigrants from Sweden (11.3%, a difference of 0.040%), Immigrants from Nepal (11.3%, a difference of 0.080%), Jordanian (11.3%, a difference of 0.10%), Zimbabwean (11.3%, a difference of 0.11%), and Tongan (11.3%, a difference of 0.12%).
| Demographics | Rating | Rank | Female Disability |
| Ethiopians | 100.0 /100 | #37 | Exceptional 11.2% |
| Immigrants | Ethiopia | 100.0 /100 | #38 | Exceptional 11.2% |
| Immigrants | Lithuania | 100.0 /100 | #39 | Exceptional 11.2% |
| Mongolians | 100.0 /100 | #40 | Exceptional 11.2% |
| Paraguayans | 100.0 /100 | #41 | Exceptional 11.2% |
| Israelis | 100.0 /100 | #42 | Exceptional 11.2% |
| Afghans | 100.0 /100 | #43 | Exceptional 11.2% |
| Cambodians | 100.0 /100 | #44 | Exceptional 11.3% |
| Immigrants | Sweden | 100.0 /100 | #45 | Exceptional 11.3% |
| Immigrants | Nepal | 100.0 /100 | #46 | Exceptional 11.3% |
| Jordanians | 100.0 /100 | #47 | Exceptional 11.3% |
| Zimbabweans | 100.0 /100 | #48 | Exceptional 11.3% |
| Tongans | 100.0 /100 | #49 | Exceptional 11.3% |
| Inupiat | 100.0 /100 | #50 | Exceptional 11.3% |
| Immigrants | Belgium | 100.0 /100 | #51 | Exceptional 11.3% |