Apache vs Ghanaian Female Disability
COMPARE
Apache
Ghanaian
Female Disability
Female Disability Comparison
Apache
Ghanaians
13.7%
FEMALE DISABILITY
0.0/ 100
METRIC RATING
310th/ 347
METRIC RANK
12.1%
FEMALE DISABILITY
76.6/ 100
METRIC RATING
155th/ 347
METRIC RANK
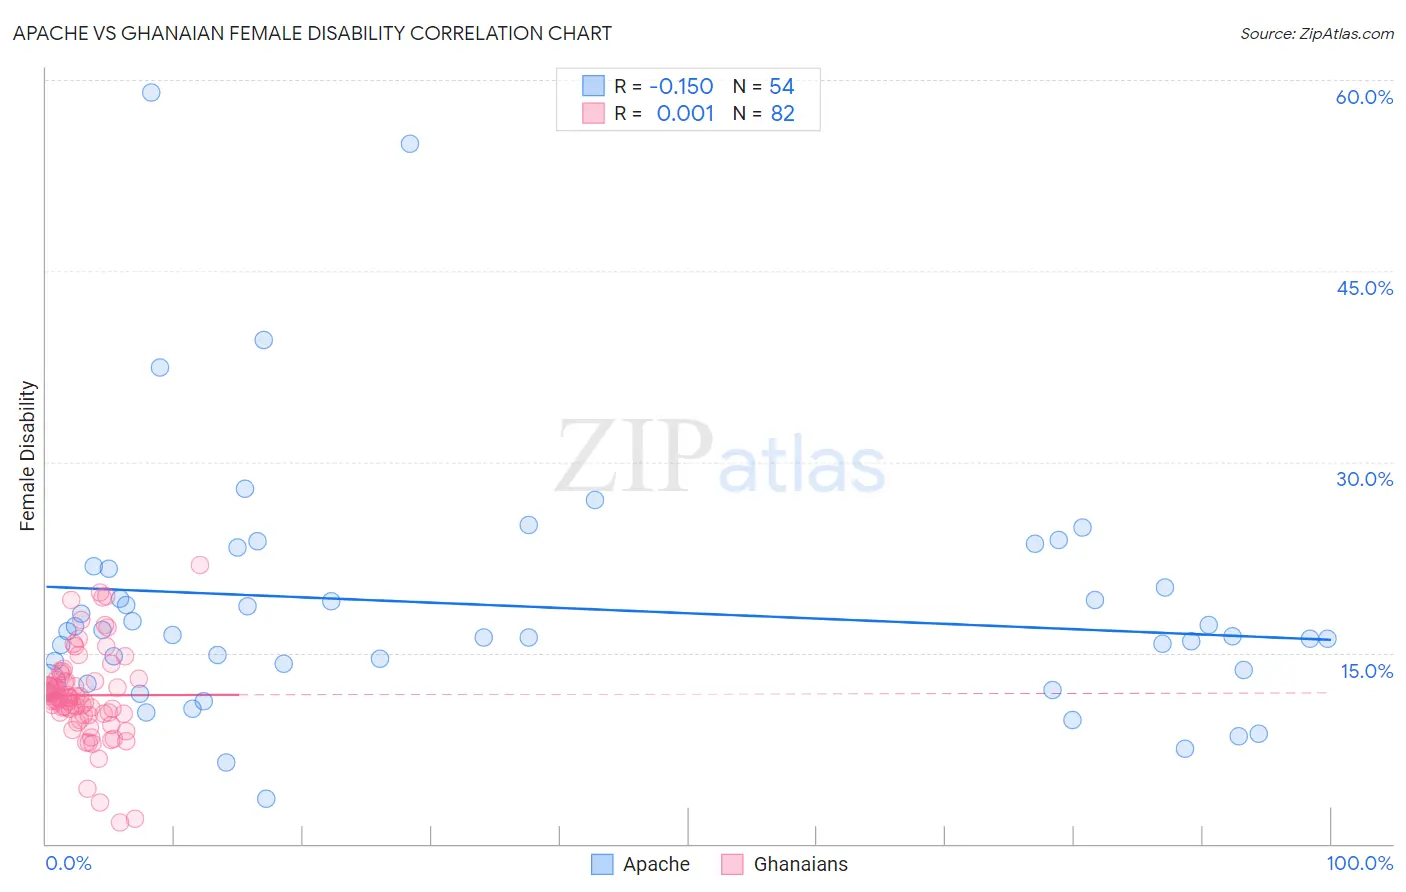
Apache vs Ghanaian Female Disability Correlation Chart
The statistical analysis conducted on geographies consisting of 231,061,138 people shows a poor negative correlation between the proportion of Apache and percentage of females with a disability in the United States with a correlation coefficient (R) of -0.150 and weighted average of 13.7%. Similarly, the statistical analysis conducted on geographies consisting of 190,696,570 people shows no correlation between the proportion of Ghanaians and percentage of females with a disability in the United States with a correlation coefficient (R) of 0.001 and weighted average of 12.1%, a difference of 13.7%.
Female Disability Correlation Summary
| Measurement | Apache | Ghanaian |
| Minimum | 3.6% | 1.6% |
| Maximum | 59.0% | 21.9% |
| Range | 55.5% | 20.2% |
| Mean | 18.7% | 11.7% |
| Median | 16.3% | 11.5% |
| Interquartile 25% (IQ1) | 13.7% | 10.2% |
| Interquartile 75% (IQ3) | 21.6% | 12.9% |
| Interquartile Range (IQR) | 7.9% | 2.7% |
| Standard Deviation (Sample) | 10.1% | 3.6% |
| Standard Deviation (Population) | 10.0% | 3.6% |
Similar Demographics by Female Disability
Demographics Similar to Apache by Female Disability
In terms of female disability, the demographic groups most similar to Apache are French American Indian (13.7%, a difference of 0.12%), Cree (13.7%, a difference of 0.18%), Hopi (13.7%, a difference of 0.29%), Delaware (13.8%, a difference of 0.60%), and Central American Indian (13.6%, a difference of 0.63%).
| Demographics | Rating | Rank | Female Disability |
| Immigrants | Portugal | 0.0 /100 | #303 | Tragic 13.5% |
| Immigrants | Micronesia | 0.0 /100 | #304 | Tragic 13.5% |
| Dominicans | 0.0 /100 | #305 | Tragic 13.5% |
| French Canadians | 0.0 /100 | #306 | Tragic 13.6% |
| Central American Indians | 0.0 /100 | #307 | Tragic 13.6% |
| Cree | 0.0 /100 | #308 | Tragic 13.7% |
| French American Indians | 0.0 /100 | #309 | Tragic 13.7% |
| Apache | 0.0 /100 | #310 | Tragic 13.7% |
| Hopi | 0.0 /100 | #311 | Tragic 13.7% |
| Delaware | 0.0 /100 | #312 | Tragic 13.8% |
| Blackfeet | 0.0 /100 | #313 | Tragic 13.8% |
| Puget Sound Salish | 0.0 /100 | #314 | Tragic 13.8% |
| Alaskan Athabascans | 0.0 /100 | #315 | Tragic 13.9% |
| Spanish Americans | 0.0 /100 | #316 | Tragic 14.0% |
| Chippewa | 0.0 /100 | #317 | Tragic 14.0% |
Demographics Similar to Ghanaians by Female Disability
In terms of female disability, the demographic groups most similar to Ghanaians are Syrian (12.1%, a difference of 0.020%), Sudanese (12.0%, a difference of 0.14%), Immigrants from Scotland (12.0%, a difference of 0.15%), Moroccan (12.1%, a difference of 0.19%), and Danish (12.1%, a difference of 0.20%).
| Demographics | Rating | Rank | Female Disability |
| Immigrants | Kenya | 83.1 /100 | #148 | Excellent 12.0% |
| Greeks | 82.0 /100 | #149 | Excellent 12.0% |
| Immigrants | Moldova | 81.4 /100 | #150 | Excellent 12.0% |
| Icelanders | 80.7 /100 | #151 | Excellent 12.0% |
| Immigrants | Scotland | 79.3 /100 | #152 | Good 12.0% |
| Sudanese | 79.1 /100 | #153 | Good 12.0% |
| Syrians | 76.9 /100 | #154 | Good 12.1% |
| Ghanaians | 76.6 /100 | #155 | Good 12.1% |
| Moroccans | 72.9 /100 | #156 | Good 12.1% |
| Danes | 72.5 /100 | #157 | Good 12.1% |
| Immigrants | Middle Africa | 72.4 /100 | #158 | Good 12.1% |
| Immigrants | Central America | 67.7 /100 | #159 | Good 12.1% |
| Immigrants | Guatemala | 66.0 /100 | #160 | Good 12.1% |
| Guyanese | 64.7 /100 | #161 | Good 12.1% |
| Immigrants | Ukraine | 64.3 /100 | #162 | Good 12.1% |