Lithuanian vs Ghanaian Median Household Income
COMPARE
Lithuanian
Ghanaian
Median Household Income
Median Household Income Comparison
Lithuanians
Ghanaians
$93,852
MEDIAN HOUSEHOLD INCOME
99.6/ 100
METRIC RATING
72nd/ 347
METRIC RANK
$83,582
MEDIAN HOUSEHOLD INCOME
27.4/ 100
METRIC RATING
194th/ 347
METRIC RANK
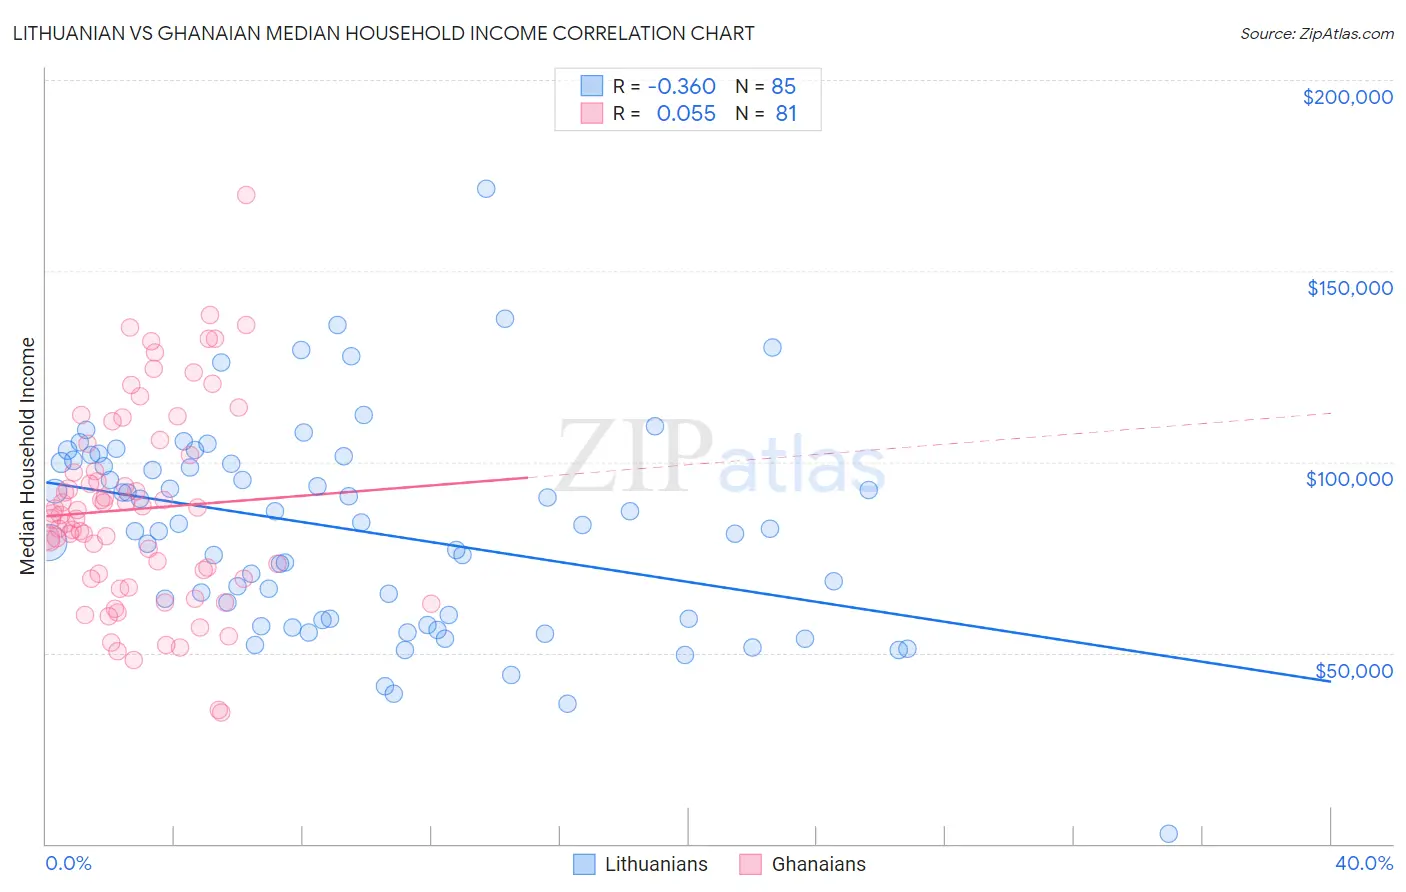
Lithuanian vs Ghanaian Median Household Income Correlation Chart
The statistical analysis conducted on geographies consisting of 421,640,790 people shows a mild negative correlation between the proportion of Lithuanians and median household income in the United States with a correlation coefficient (R) of -0.360 and weighted average of $93,852. Similarly, the statistical analysis conducted on geographies consisting of 190,498,021 people shows a slight positive correlation between the proportion of Ghanaians and median household income in the United States with a correlation coefficient (R) of 0.055 and weighted average of $83,582, a difference of 12.3%.
Median Household Income Correlation Summary
| Measurement | Lithuanian | Ghanaian |
| Minimum | $2,499 | $34,375 |
| Maximum | $171,528 | $169,773 |
| Range | $169,029 | $135,398 |
| Mean | $81,905 | $87,698 |
| Median | $82,500 | $86,122 |
| Interquartile 25% (IQ1) | $58,701 | $69,414 |
| Interquartile 75% (IQ3) | $100,159 | $103,226 |
| Interquartile Range (IQR) | $41,458 | $33,812 |
| Standard Deviation (Sample) | $27,290 | $26,089 |
| Standard Deviation (Population) | $27,129 | $25,928 |
Similar Demographics by Median Household Income
Demographics Similar to Lithuanians by Median Household Income
In terms of median household income, the demographic groups most similar to Lithuanians are Immigrants from Philippines ($93,899, a difference of 0.050%), Immigrants from Fiji ($93,933, a difference of 0.090%), Argentinean ($93,960, a difference of 0.11%), Mongolian ($93,971, a difference of 0.13%), and Immigrants from Egypt ($93,700, a difference of 0.16%).
| Demographics | Rating | Rank | Median Household Income |
| Immigrants | Belarus | 99.7 /100 | #65 | Exceptional $94,399 |
| Immigrants | Romania | 99.7 /100 | #66 | Exceptional $94,222 |
| Immigrants | Scotland | 99.7 /100 | #67 | Exceptional $94,091 |
| Mongolians | 99.7 /100 | #68 | Exceptional $93,971 |
| Argentineans | 99.7 /100 | #69 | Exceptional $93,960 |
| Immigrants | Fiji | 99.7 /100 | #70 | Exceptional $93,933 |
| Immigrants | Philippines | 99.6 /100 | #71 | Exceptional $93,899 |
| Lithuanians | 99.6 /100 | #72 | Exceptional $93,852 |
| Immigrants | Egypt | 99.6 /100 | #73 | Exceptional $93,700 |
| Immigrants | Latvia | 99.6 /100 | #74 | Exceptional $93,602 |
| Immigrants | Italy | 99.5 /100 | #75 | Exceptional $93,465 |
| South Africans | 99.5 /100 | #76 | Exceptional $93,379 |
| Immigrants | Afghanistan | 99.5 /100 | #77 | Exceptional $93,375 |
| Immigrants | Bulgaria | 99.4 /100 | #78 | Exceptional $93,148 |
| Sri Lankans | 99.4 /100 | #79 | Exceptional $93,093 |
Demographics Similar to Ghanaians by Median Household Income
In terms of median household income, the demographic groups most similar to Ghanaians are Finnish ($83,607, a difference of 0.030%), Immigrants from Armenia ($83,555, a difference of 0.030%), Welsh ($83,628, a difference of 0.060%), French ($83,468, a difference of 0.14%), and Aleut ($83,446, a difference of 0.16%).
| Demographics | Rating | Rank | Median Household Income |
| Belgians | 33.2 /100 | #187 | Fair $84,008 |
| Tlingit-Haida | 32.6 /100 | #188 | Fair $83,968 |
| Immigrants | Colombia | 31.7 /100 | #189 | Fair $83,902 |
| Slovaks | 30.2 /100 | #190 | Fair $83,798 |
| Iraqis | 29.6 /100 | #191 | Fair $83,753 |
| Welsh | 28.0 /100 | #192 | Fair $83,628 |
| Finns | 27.7 /100 | #193 | Fair $83,607 |
| Ghanaians | 27.4 /100 | #194 | Fair $83,582 |
| Immigrants | Armenia | 27.0 /100 | #195 | Fair $83,555 |
| French | 26.0 /100 | #196 | Fair $83,468 |
| Aleuts | 25.7 /100 | #197 | Fair $83,446 |
| Japanese | 25.1 /100 | #198 | Fair $83,395 |
| Germans | 24.6 /100 | #199 | Fair $83,358 |
| Tsimshian | 24.5 /100 | #200 | Fair $83,346 |
| Spanish | 24.4 /100 | #201 | Fair $83,343 |