Lithuanian vs American Child Poverty Under the Age of 5
COMPARE
Lithuanian
American
Child Poverty Under the Age of 5
Child Poverty Under the Age of 5 Comparison
Lithuanians
Americans
15.2%
CHILD POVERTY UNDER THE AGE OF 5
99.0/ 100
METRIC RATING
69th/ 347
METRIC RANK
20.5%
CHILD POVERTY UNDER THE AGE OF 5
0.1/ 100
METRIC RATING
271st/ 347
METRIC RANK
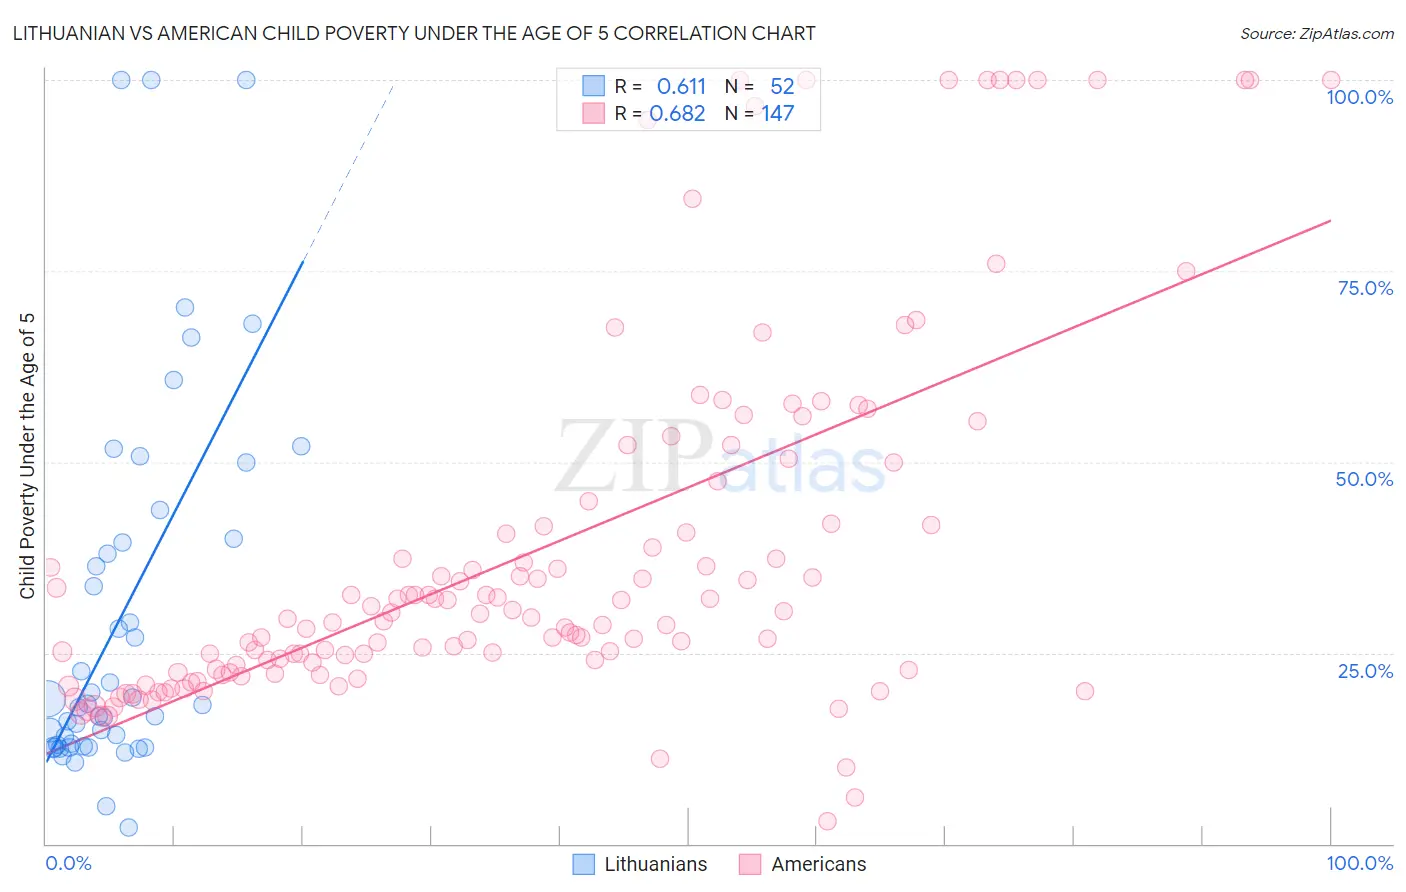
Lithuanian vs American Child Poverty Under the Age of 5 Correlation Chart
The statistical analysis conducted on geographies consisting of 398,178,552 people shows a significant positive correlation between the proportion of Lithuanians and poverty level among children under the age of 5 in the United States with a correlation coefficient (R) of 0.611 and weighted average of 15.2%. Similarly, the statistical analysis conducted on geographies consisting of 538,793,741 people shows a significant positive correlation between the proportion of Americans and poverty level among children under the age of 5 in the United States with a correlation coefficient (R) of 0.682 and weighted average of 20.5%, a difference of 34.7%.
Child Poverty Under the Age of 5 Correlation Summary
| Measurement | Lithuanian | American |
| Minimum | 2.2% | 2.9% |
| Maximum | 100.0% | 100.0% |
| Range | 97.8% | 97.1% |
| Mean | 29.8% | 38.1% |
| Median | 18.3% | 29.6% |
| Interquartile 25% (IQ1) | 12.9% | 22.8% |
| Interquartile 75% (IQ3) | 39.7% | 41.9% |
| Interquartile Range (IQR) | 26.9% | 19.1% |
| Standard Deviation (Sample) | 24.5% | 23.8% |
| Standard Deviation (Population) | 24.2% | 23.7% |
Similar Demographics by Child Poverty Under the Age of 5
Demographics Similar to Lithuanians by Child Poverty Under the Age of 5
In terms of child poverty under the age of 5, the demographic groups most similar to Lithuanians are Zimbabwean (15.2%, a difference of 0.010%), Greek (15.2%, a difference of 0.020%), Immigrants from Scotland (15.2%, a difference of 0.080%), Immigrants from Fiji (15.2%, a difference of 0.19%), and Immigrants from Romania (15.2%, a difference of 0.22%).
| Demographics | Rating | Rank | Child Poverty Under the Age of 5 |
| Immigrants | Eastern Europe | 99.1 /100 | #62 | Exceptional 15.1% |
| Immigrants | Europe | 99.1 /100 | #63 | Exceptional 15.1% |
| Immigrants | Romania | 99.1 /100 | #64 | Exceptional 15.2% |
| Immigrants | Fiji | 99.0 /100 | #65 | Exceptional 15.2% |
| Immigrants | Scotland | 99.0 /100 | #66 | Exceptional 15.2% |
| Greeks | 99.0 /100 | #67 | Exceptional 15.2% |
| Zimbabweans | 99.0 /100 | #68 | Exceptional 15.2% |
| Lithuanians | 99.0 /100 | #69 | Exceptional 15.2% |
| Immigrants | Belgium | 98.8 /100 | #70 | Exceptional 15.3% |
| Immigrants | Egypt | 98.8 /100 | #71 | Exceptional 15.3% |
| Immigrants | Sweden | 98.8 /100 | #72 | Exceptional 15.3% |
| Immigrants | Ukraine | 98.7 /100 | #73 | Exceptional 15.3% |
| Argentineans | 98.5 /100 | #74 | Exceptional 15.4% |
| Immigrants | Argentina | 98.5 /100 | #75 | Exceptional 15.4% |
| Croatians | 98.5 /100 | #76 | Exceptional 15.4% |
Demographics Similar to Americans by Child Poverty Under the Age of 5
In terms of child poverty under the age of 5, the demographic groups most similar to Americans are Immigrants from Jamaica (20.5%, a difference of 0.12%), Jamaican (20.4%, a difference of 0.45%), Immigrants from Burma/Myanmar (20.4%, a difference of 0.52%), Ottawa (20.3%, a difference of 0.61%), and Belizean (20.3%, a difference of 0.61%).
| Demographics | Rating | Rank | Child Poverty Under the Age of 5 |
| Immigrants | Liberia | 0.1 /100 | #264 | Tragic 20.2% |
| Spanish American Indians | 0.1 /100 | #265 | Tragic 20.2% |
| Aleuts | 0.1 /100 | #266 | Tragic 20.3% |
| Ottawa | 0.1 /100 | #267 | Tragic 20.3% |
| Belizeans | 0.1 /100 | #268 | Tragic 20.3% |
| Immigrants | Burma/Myanmar | 0.1 /100 | #269 | Tragic 20.4% |
| Jamaicans | 0.1 /100 | #270 | Tragic 20.4% |
| Americans | 0.1 /100 | #271 | Tragic 20.5% |
| Immigrants | Jamaica | 0.1 /100 | #272 | Tragic 20.5% |
| Central Americans | 0.1 /100 | #273 | Tragic 20.6% |
| Immigrants | Belize | 0.1 /100 | #274 | Tragic 20.6% |
| Bangladeshis | 0.1 /100 | #275 | Tragic 20.6% |
| West Indians | 0.0 /100 | #276 | Tragic 20.6% |
| Immigrants | West Indies | 0.0 /100 | #277 | Tragic 20.7% |
| Immigrants | Grenada | 0.0 /100 | #278 | Tragic 20.7% |