Immigrants from Western Africa vs American Female Disability
COMPARE
Immigrants from Western Africa
American
Female Disability
Female Disability Comparison
Immigrants from Western Africa
Americans
12.3%
FEMALE DISABILITY
29.2/ 100
METRIC RATING
192nd/ 347
METRIC RANK
14.1%
FEMALE DISABILITY
0.0/ 100
METRIC RATING
320th/ 347
METRIC RANK
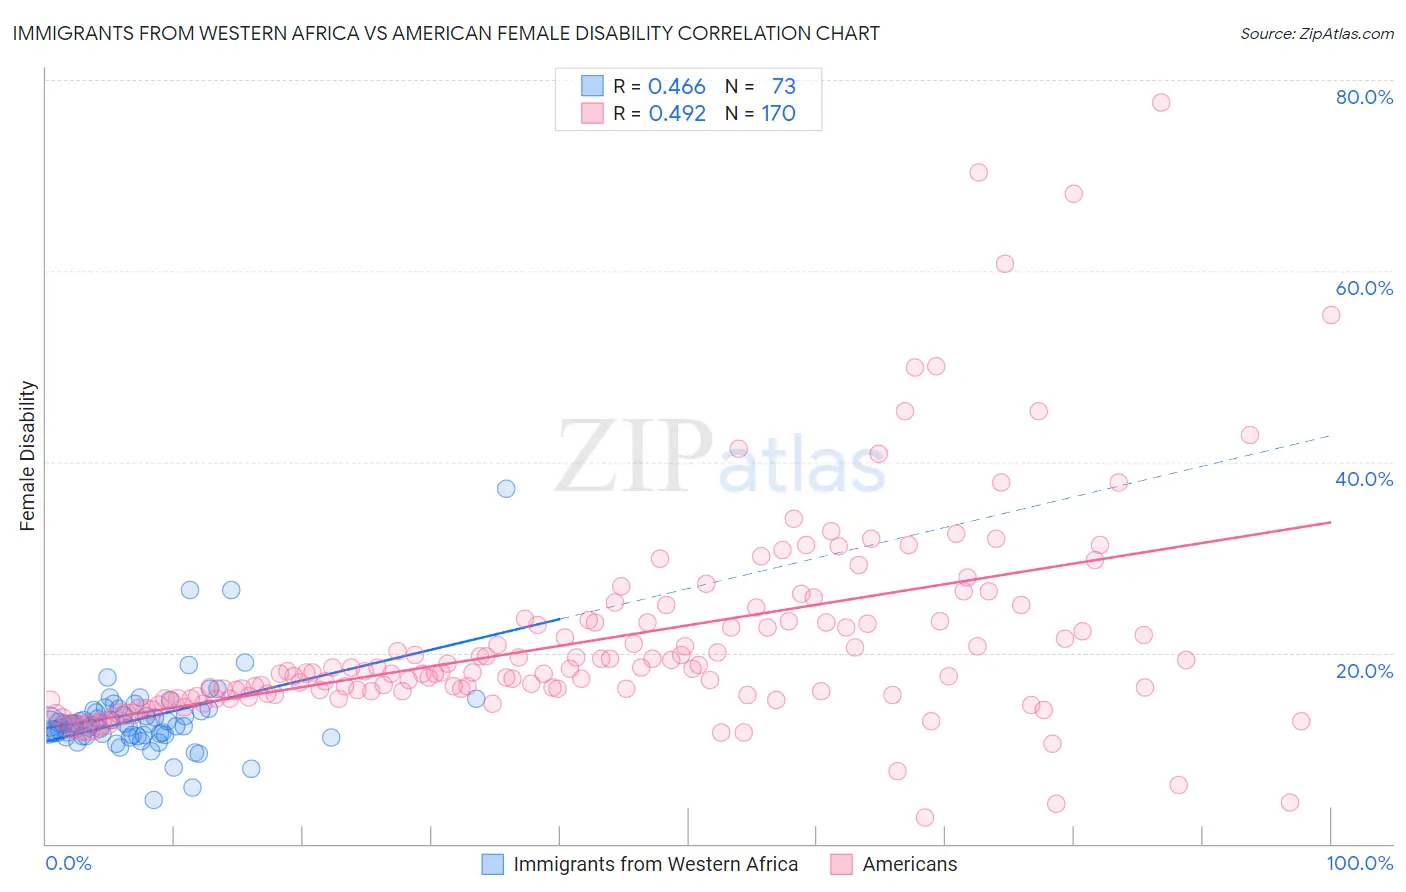
Immigrants from Western Africa vs American Female Disability Correlation Chart
The statistical analysis conducted on geographies consisting of 357,800,651 people shows a moderate positive correlation between the proportion of Immigrants from Western Africa and percentage of females with a disability in the United States with a correlation coefficient (R) of 0.466 and weighted average of 12.3%. Similarly, the statistical analysis conducted on geographies consisting of 581,542,152 people shows a moderate positive correlation between the proportion of Americans and percentage of females with a disability in the United States with a correlation coefficient (R) of 0.492 and weighted average of 14.1%, a difference of 14.6%.
Female Disability Correlation Summary
| Measurement | Immigrants from Western Africa | American |
| Minimum | 4.6% | 2.7% |
| Maximum | 37.1% | 77.6% |
| Range | 32.5% | 74.9% |
| Mean | 13.1% | 21.4% |
| Median | 12.5% | 17.9% |
| Interquartile 25% (IQ1) | 11.3% | 15.4% |
| Interquartile 75% (IQ3) | 13.9% | 23.3% |
| Interquartile Range (IQR) | 2.6% | 7.9% |
| Standard Deviation (Sample) | 4.4% | 11.3% |
| Standard Deviation (Population) | 4.3% | 11.2% |
Similar Demographics by Female Disability
Demographics Similar to Immigrants from Western Africa by Female Disability
In terms of female disability, the demographic groups most similar to Immigrants from Western Africa are Armenian (12.3%, a difference of 0.020%), Northern European (12.3%, a difference of 0.080%), Immigrants from Honduras (12.3%, a difference of 0.090%), Ukrainian (12.3%, a difference of 0.090%), and Immigrants from Albania (12.3%, a difference of 0.10%).
| Demographics | Rating | Rank | Female Disability |
| Immigrants | Uzbekistan | 33.9 /100 | #185 | Fair 12.3% |
| Austrians | 33.3 /100 | #186 | Fair 12.3% |
| Serbians | 33.1 /100 | #187 | Fair 12.3% |
| Immigrants | North America | 32.8 /100 | #188 | Fair 12.3% |
| Immigrants | Albania | 31.6 /100 | #189 | Fair 12.3% |
| Immigrants | Honduras | 31.3 /100 | #190 | Fair 12.3% |
| Armenians | 29.7 /100 | #191 | Fair 12.3% |
| Immigrants | Western Africa | 29.2 /100 | #192 | Fair 12.3% |
| Northern Europeans | 27.5 /100 | #193 | Fair 12.3% |
| Ukrainians | 27.2 /100 | #194 | Fair 12.3% |
| Swedes | 26.6 /100 | #195 | Fair 12.3% |
| Immigrants | Panama | 25.5 /100 | #196 | Fair 12.3% |
| Hondurans | 25.4 /100 | #197 | Fair 12.3% |
| Mexican American Indians | 24.9 /100 | #198 | Fair 12.3% |
| Immigrants | Trinidad and Tobago | 24.7 /100 | #199 | Fair 12.3% |
Demographics Similar to Americans by Female Disability
In terms of female disability, the demographic groups most similar to Americans are Potawatomi (14.1%, a difference of 0.14%), Pueblo (14.1%, a difference of 0.15%), Black/African American (14.1%, a difference of 0.31%), Native/Alaskan (14.1%, a difference of 0.33%), and Iroquois (14.0%, a difference of 0.34%).
| Demographics | Rating | Rank | Female Disability |
| Blackfeet | 0.0 /100 | #313 | Tragic 13.8% |
| Puget Sound Salish | 0.0 /100 | #314 | Tragic 13.8% |
| Alaskan Athabascans | 0.0 /100 | #315 | Tragic 13.9% |
| Spanish Americans | 0.0 /100 | #316 | Tragic 14.0% |
| Chippewa | 0.0 /100 | #317 | Tragic 14.0% |
| Paiute | 0.0 /100 | #318 | Tragic 14.0% |
| Iroquois | 0.0 /100 | #319 | Tragic 14.0% |
| Americans | 0.0 /100 | #320 | Tragic 14.1% |
| Potawatomi | 0.0 /100 | #321 | Tragic 14.1% |
| Pueblo | 0.0 /100 | #322 | Tragic 14.1% |
| Blacks/African Americans | 0.0 /100 | #323 | Tragic 14.1% |
| Natives/Alaskans | 0.0 /100 | #324 | Tragic 14.1% |
| Navajo | 0.0 /100 | #325 | Tragic 14.2% |
| Comanche | 0.0 /100 | #326 | Tragic 14.2% |
| Ottawa | 0.0 /100 | #327 | Tragic 14.2% |