Pueblo vs American Female Disability
COMPARE
Pueblo
American
Female Disability
Female Disability Comparison
Pueblo
Americans
14.1%
FEMALE DISABILITY
0.0/ 100
METRIC RATING
322nd/ 347
METRIC RANK
14.1%
FEMALE DISABILITY
0.0/ 100
METRIC RATING
320th/ 347
METRIC RANK
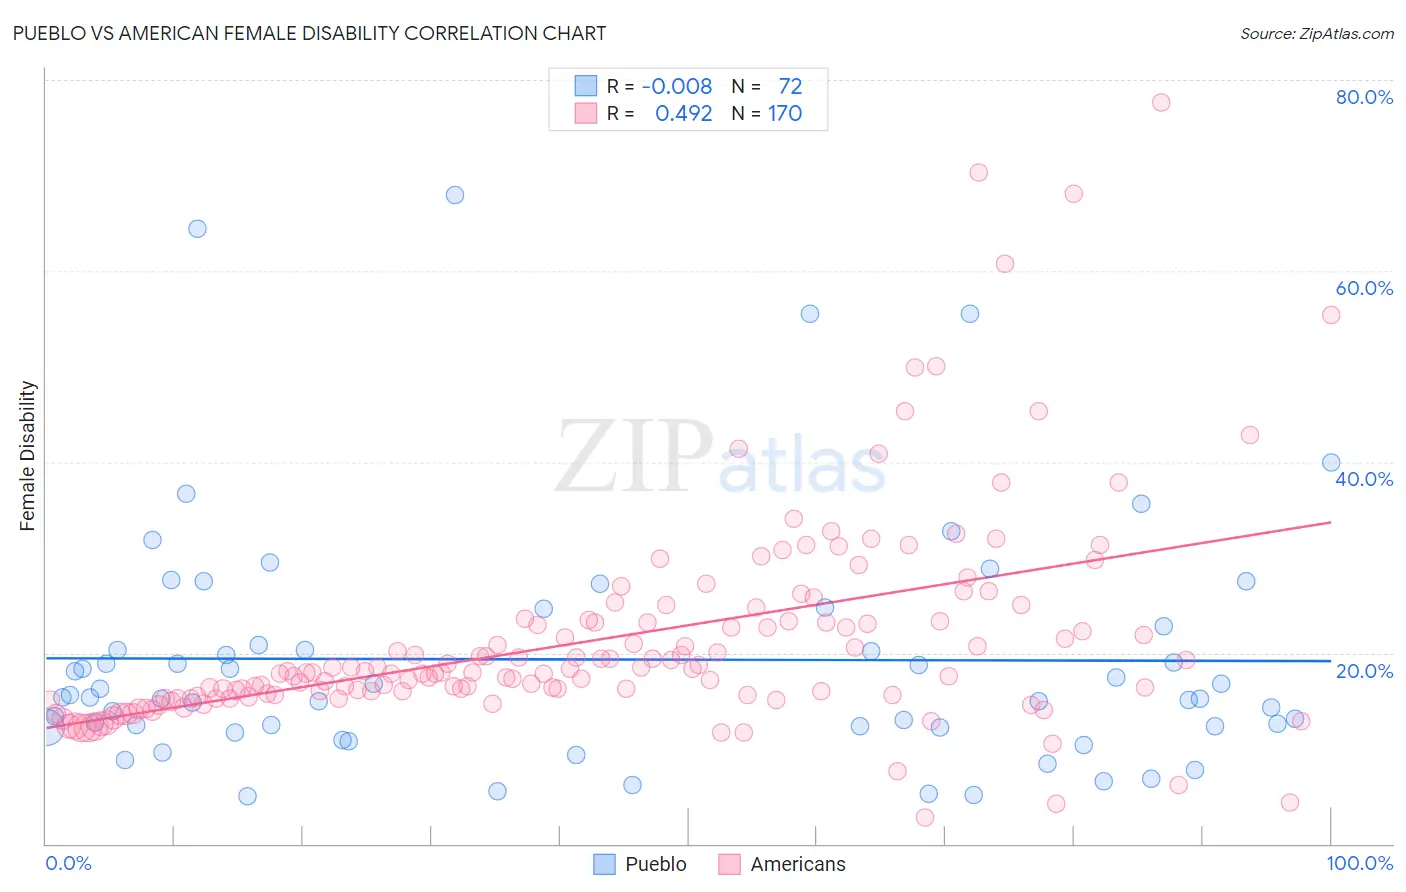
Pueblo vs American Female Disability Correlation Chart
The statistical analysis conducted on geographies consisting of 120,072,777 people shows no correlation between the proportion of Pueblo and percentage of females with a disability in the United States with a correlation coefficient (R) of -0.008 and weighted average of 14.1%. Similarly, the statistical analysis conducted on geographies consisting of 581,542,152 people shows a moderate positive correlation between the proportion of Americans and percentage of females with a disability in the United States with a correlation coefficient (R) of 0.492 and weighted average of 14.1%, a difference of 0.15%.
Female Disability Correlation Summary
| Measurement | Pueblo | American |
| Minimum | 5.0% | 2.7% |
| Maximum | 67.9% | 77.6% |
| Range | 62.9% | 74.9% |
| Mean | 19.3% | 21.4% |
| Median | 15.4% | 17.9% |
| Interquartile 25% (IQ1) | 12.3% | 15.4% |
| Interquartile 75% (IQ3) | 21.8% | 23.3% |
| Interquartile Range (IQR) | 9.5% | 7.9% |
| Standard Deviation (Sample) | 12.9% | 11.3% |
| Standard Deviation (Population) | 12.8% | 11.2% |
Demographics Similar to Pueblo and Americans by Female Disability
In terms of female disability, the demographic groups most similar to Pueblo are Potawatomi (14.1%, a difference of 0.010%), Black/African American (14.1%, a difference of 0.17%), Native/Alaskan (14.1%, a difference of 0.18%), Navajo (14.2%, a difference of 0.32%), and Comanche (14.2%, a difference of 0.43%). Similarly, the demographic groups most similar to Americans are Potawatomi (14.1%, a difference of 0.14%), Black/African American (14.1%, a difference of 0.31%), Native/Alaskan (14.1%, a difference of 0.33%), Iroquois (14.0%, a difference of 0.34%), and Navajo (14.2%, a difference of 0.47%).
| Demographics | Rating | Rank | Female Disability |
| Hopi | 0.0 /100 | #311 | Tragic 13.7% |
| Delaware | 0.0 /100 | #312 | Tragic 13.8% |
| Blackfeet | 0.0 /100 | #313 | Tragic 13.8% |
| Puget Sound Salish | 0.0 /100 | #314 | Tragic 13.8% |
| Alaskan Athabascans | 0.0 /100 | #315 | Tragic 13.9% |
| Spanish Americans | 0.0 /100 | #316 | Tragic 14.0% |
| Chippewa | 0.0 /100 | #317 | Tragic 14.0% |
| Paiute | 0.0 /100 | #318 | Tragic 14.0% |
| Iroquois | 0.0 /100 | #319 | Tragic 14.0% |
| Americans | 0.0 /100 | #320 | Tragic 14.1% |
| Potawatomi | 0.0 /100 | #321 | Tragic 14.1% |
| Pueblo | 0.0 /100 | #322 | Tragic 14.1% |
| Blacks/African Americans | 0.0 /100 | #323 | Tragic 14.1% |
| Natives/Alaskans | 0.0 /100 | #324 | Tragic 14.1% |
| Navajo | 0.0 /100 | #325 | Tragic 14.2% |
| Comanche | 0.0 /100 | #326 | Tragic 14.2% |
| Ottawa | 0.0 /100 | #327 | Tragic 14.2% |
| Cape Verdeans | 0.0 /100 | #328 | Tragic 14.2% |
| Osage | 0.0 /100 | #329 | Tragic 14.3% |
| Yuman | 0.0 /100 | #330 | Tragic 14.5% |
| Immigrants | Cabo Verde | 0.0 /100 | #331 | Tragic 14.6% |