Lithuanian vs American Master's Degree
COMPARE
Lithuanian
American
Master's Degree
Master's Degree Comparison
Lithuanians
Americans
17.7%
MASTER'S DEGREE
99.7/ 100
METRIC RATING
72nd/ 347
METRIC RANK
12.3%
MASTER'S DEGREE
0.4/ 100
METRIC RATING
267th/ 347
METRIC RANK
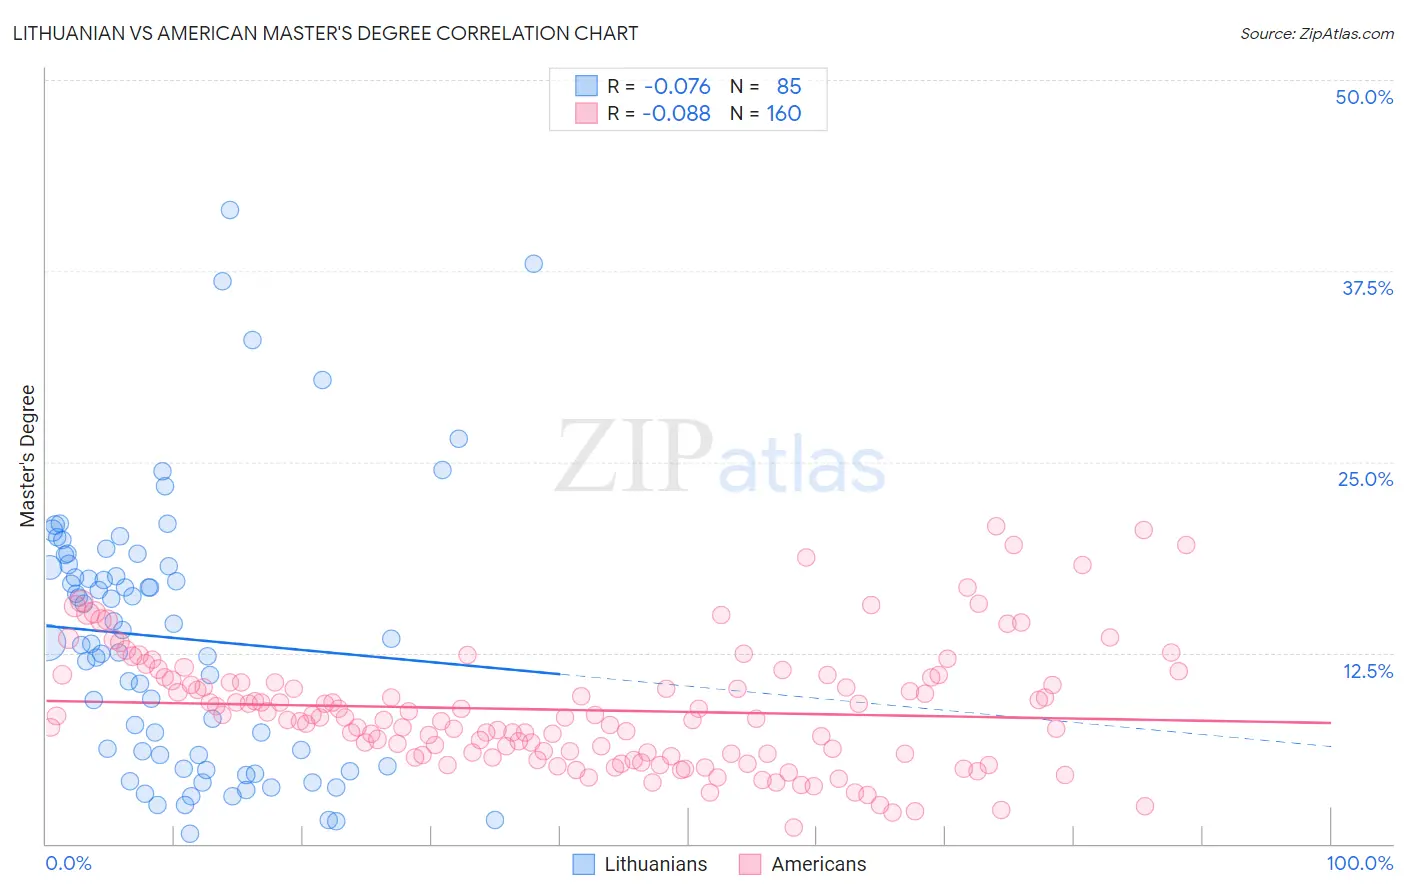
Lithuanian vs American Master's Degree Correlation Chart
The statistical analysis conducted on geographies consisting of 421,813,641 people shows a slight negative correlation between the proportion of Lithuanians and percentage of population with at least master's degree education in the United States with a correlation coefficient (R) of -0.076 and weighted average of 17.7%. Similarly, the statistical analysis conducted on geographies consisting of 580,510,045 people shows a slight negative correlation between the proportion of Americans and percentage of population with at least master's degree education in the United States with a correlation coefficient (R) of -0.088 and weighted average of 12.3%, a difference of 44.2%.
Master's Degree Correlation Summary
| Measurement | Lithuanian | American |
| Minimum | 0.63% | 1.1% |
| Maximum | 41.5% | 20.8% |
| Range | 40.9% | 19.8% |
| Mean | 13.5% | 8.8% |
| Median | 13.2% | 8.3% |
| Interquartile 25% (IQ1) | 5.4% | 5.9% |
| Interquartile 75% (IQ3) | 18.2% | 10.8% |
| Interquartile Range (IQR) | 12.8% | 4.9% |
| Standard Deviation (Sample) | 8.8% | 3.9% |
| Standard Deviation (Population) | 8.7% | 3.9% |
Similar Demographics by Master's Degree
Demographics Similar to Lithuanians by Master's Degree
In terms of master's degree, the demographic groups most similar to Lithuanians are Zimbabwean (17.7%, a difference of 0.11%), Immigrants from Pakistan (17.8%, a difference of 0.17%), Immigrants from Romania (17.7%, a difference of 0.41%), Immigrants from Western Europe (17.8%, a difference of 0.46%), and Immigrants from Uzbekistan (17.9%, a difference of 0.67%).
| Demographics | Rating | Rank | Master's Degree |
| Immigrants | Kazakhstan | 99.8 /100 | #65 | Exceptional 18.0% |
| Ethiopians | 99.8 /100 | #66 | Exceptional 18.0% |
| Immigrants | Argentina | 99.8 /100 | #67 | Exceptional 18.0% |
| Immigrants | Ethiopia | 99.8 /100 | #68 | Exceptional 17.9% |
| Immigrants | Uzbekistan | 99.8 /100 | #69 | Exceptional 17.9% |
| Immigrants | Western Europe | 99.8 /100 | #70 | Exceptional 17.8% |
| Immigrants | Pakistan | 99.7 /100 | #71 | Exceptional 17.8% |
| Lithuanians | 99.7 /100 | #72 | Exceptional 17.7% |
| Zimbabweans | 99.7 /100 | #73 | Exceptional 17.7% |
| Immigrants | Romania | 99.7 /100 | #74 | Exceptional 17.7% |
| Egyptians | 99.6 /100 | #75 | Exceptional 17.6% |
| Immigrants | Indonesia | 99.6 /100 | #76 | Exceptional 17.6% |
| Immigrants | Eastern Europe | 99.6 /100 | #77 | Exceptional 17.6% |
| Immigrants | Hungary | 99.6 /100 | #78 | Exceptional 17.5% |
| Immigrants | Lebanon | 99.6 /100 | #79 | Exceptional 17.5% |
Demographics Similar to Americans by Master's Degree
In terms of master's degree, the demographic groups most similar to Americans are Native Hawaiian (12.3%, a difference of 0.25%), Bahamian (12.4%, a difference of 0.76%), Central American (12.2%, a difference of 0.90%), Immigrants from Fiji (12.4%, a difference of 0.91%), and Belizean (12.4%, a difference of 0.93%).
| Demographics | Rating | Rank | Master's Degree |
| Dominicans | 0.6 /100 | #260 | Tragic 12.5% |
| Tongans | 0.6 /100 | #261 | Tragic 12.5% |
| Nicaraguans | 0.6 /100 | #262 | Tragic 12.5% |
| Central American Indians | 0.5 /100 | #263 | Tragic 12.4% |
| Belizeans | 0.5 /100 | #264 | Tragic 12.4% |
| Immigrants | Fiji | 0.5 /100 | #265 | Tragic 12.4% |
| Bahamians | 0.5 /100 | #266 | Tragic 12.4% |
| Americans | 0.4 /100 | #267 | Tragic 12.3% |
| Native Hawaiians | 0.4 /100 | #268 | Tragic 12.3% |
| Central Americans | 0.3 /100 | #269 | Tragic 12.2% |
| Salvadorans | 0.3 /100 | #270 | Tragic 12.2% |
| Haitians | 0.3 /100 | #271 | Tragic 12.1% |
| Comanche | 0.3 /100 | #272 | Tragic 12.1% |
| Blackfeet | 0.3 /100 | #273 | Tragic 12.1% |
| Cape Verdeans | 0.3 /100 | #274 | Tragic 12.1% |