Lithuanian vs American Births to Unmarried Women
COMPARE
Lithuanian
American
Births to Unmarried Women
Births to Unmarried Women Comparison
Lithuanians
Americans
29.6%
BIRTHS TO UNMARRIED WOMEN
94.4/ 100
METRIC RATING
104th/ 347
METRIC RANK
36.4%
BIRTHS TO UNMARRIED WOMEN
0.2/ 100
METRIC RATING
258th/ 347
METRIC RANK
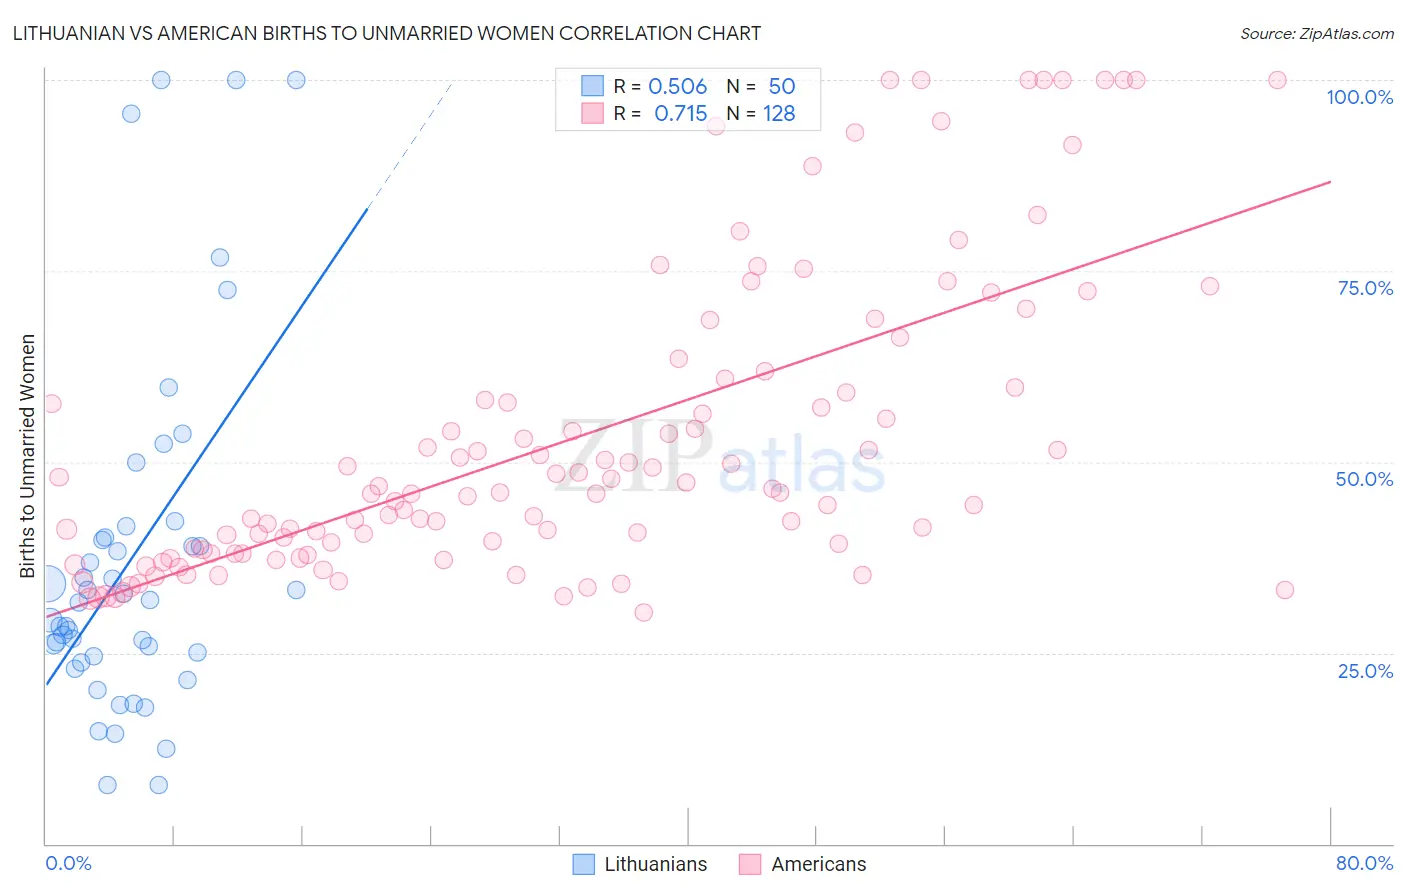
Lithuanian vs American Births to Unmarried Women Correlation Chart
The statistical analysis conducted on geographies consisting of 385,212,926 people shows a substantial positive correlation between the proportion of Lithuanians and percentage of births to unmarried women in the United States with a correlation coefficient (R) of 0.506 and weighted average of 29.6%. Similarly, the statistical analysis conducted on geographies consisting of 512,571,138 people shows a strong positive correlation between the proportion of Americans and percentage of births to unmarried women in the United States with a correlation coefficient (R) of 0.715 and weighted average of 36.4%, a difference of 23.2%.
Births to Unmarried Women Correlation Summary
| Measurement | Lithuanian | American |
| Minimum | 7.7% | 30.2% |
| Maximum | 100.0% | 100.0% |
| Range | 92.3% | 69.8% |
| Mean | 37.3% | 53.1% |
| Median | 31.8% | 46.0% |
| Interquartile 25% (IQ1) | 24.6% | 38.3% |
| Interquartile 75% (IQ3) | 40.0% | 60.3% |
| Interquartile Range (IQR) | 15.4% | 22.0% |
| Standard Deviation (Sample) | 23.1% | 19.8% |
| Standard Deviation (Population) | 22.9% | 19.7% |
Similar Demographics by Births to Unmarried Women
Demographics Similar to Lithuanians by Births to Unmarried Women
In terms of births to unmarried women, the demographic groups most similar to Lithuanians are Lebanese (29.5%, a difference of 0.010%), Immigrants from Nepal (29.6%, a difference of 0.050%), Australian (29.5%, a difference of 0.060%), Immigrants from Northern Africa (29.5%, a difference of 0.14%), and Swedish (29.6%, a difference of 0.30%).
| Demographics | Rating | Rank | Births to Unmarried Women |
| Immigrants | South Africa | 95.7 /100 | #97 | Exceptional 29.3% |
| Immigrants | Syria | 95.7 /100 | #98 | Exceptional 29.4% |
| Immigrants | Denmark | 95.3 /100 | #99 | Exceptional 29.4% |
| Luxembourgers | 95.2 /100 | #100 | Exceptional 29.4% |
| Immigrants | Northern Africa | 94.7 /100 | #101 | Exceptional 29.5% |
| Australians | 94.6 /100 | #102 | Exceptional 29.5% |
| Lebanese | 94.4 /100 | #103 | Exceptional 29.5% |
| Lithuanians | 94.4 /100 | #104 | Exceptional 29.6% |
| Immigrants | Nepal | 94.3 /100 | #105 | Exceptional 29.6% |
| Swedes | 93.8 /100 | #106 | Exceptional 29.6% |
| Immigrants | Brazil | 93.7 /100 | #107 | Exceptional 29.6% |
| Paraguayans | 93.5 /100 | #108 | Exceptional 29.7% |
| Greeks | 93.4 /100 | #109 | Exceptional 29.7% |
| Immigrants | Ethiopia | 93.4 /100 | #110 | Exceptional 29.7% |
| Immigrants | Hungary | 93.0 /100 | #111 | Exceptional 29.7% |
Demographics Similar to Americans by Births to Unmarried Women
In terms of births to unmarried women, the demographic groups most similar to Americans are Immigrants from El Salvador (36.4%, a difference of 0.050%), Ottawa (36.5%, a difference of 0.16%), Trinidadian and Tobagonian (36.5%, a difference of 0.17%), Immigrants from Grenada (36.3%, a difference of 0.28%), and Chickasaw (36.3%, a difference of 0.31%).
| Demographics | Rating | Rank | Births to Unmarried Women |
| Immigrants | Western Africa | 0.3 /100 | #251 | Tragic 36.0% |
| Salvadorans | 0.3 /100 | #252 | Tragic 36.0% |
| Immigrants | Portugal | 0.2 /100 | #253 | Tragic 36.2% |
| Potawatomi | 0.2 /100 | #254 | Tragic 36.2% |
| Chickasaw | 0.2 /100 | #255 | Tragic 36.3% |
| Immigrants | Trinidad and Tobago | 0.2 /100 | #256 | Tragic 36.3% |
| Immigrants | Grenada | 0.2 /100 | #257 | Tragic 36.3% |
| Americans | 0.2 /100 | #258 | Tragic 36.4% |
| Immigrants | El Salvador | 0.2 /100 | #259 | Tragic 36.4% |
| Ottawa | 0.2 /100 | #260 | Tragic 36.5% |
| Trinidadians and Tobagonians | 0.2 /100 | #261 | Tragic 36.5% |
| French American Indians | 0.1 /100 | #262 | Tragic 36.6% |
| Nicaraguans | 0.1 /100 | #263 | Tragic 36.6% |
| Sub-Saharan Africans | 0.1 /100 | #264 | Tragic 36.7% |
| Cherokee | 0.1 /100 | #265 | Tragic 36.7% |