Lithuanian vs African Kindergarten
COMPARE
Lithuanian
African
Kindergarten
Kindergarten Comparison
Lithuanians
Africans
98.6%
KINDERGARTEN
100.0/ 100
METRIC RATING
21st/ 347
METRIC RANK
97.8%
KINDERGARTEN
16.1/ 100
METRIC RATING
207th/ 347
METRIC RANK
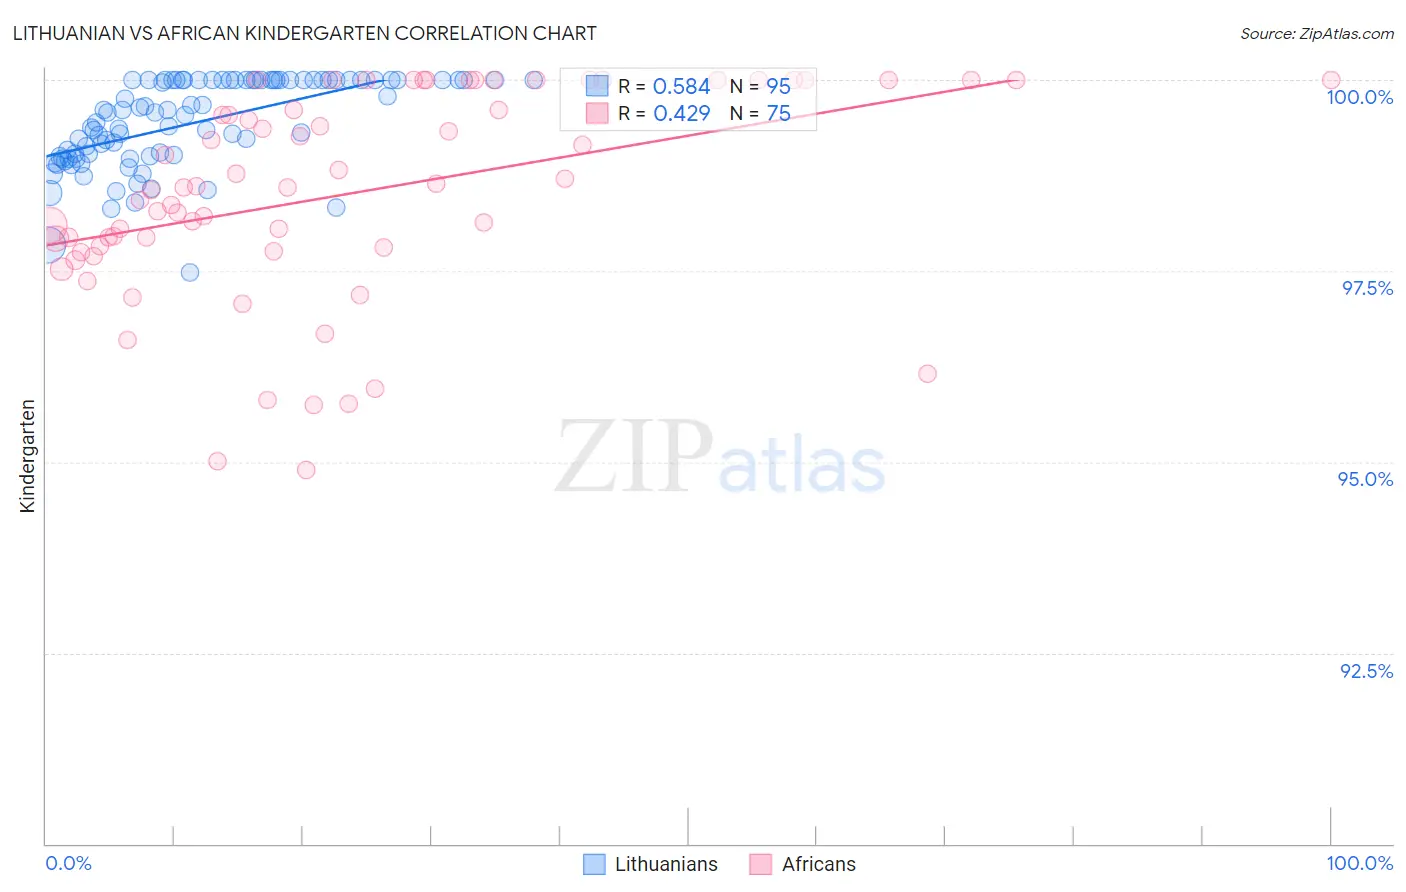
Lithuanian vs African Kindergarten Correlation Chart
The statistical analysis conducted on geographies consisting of 421,946,231 people shows a substantial positive correlation between the proportion of Lithuanians and percentage of population with at least kindergarten education in the United States with a correlation coefficient (R) of 0.584 and weighted average of 98.6%. Similarly, the statistical analysis conducted on geographies consisting of 470,094,148 people shows a moderate positive correlation between the proportion of Africans and percentage of population with at least kindergarten education in the United States with a correlation coefficient (R) of 0.429 and weighted average of 97.8%, a difference of 0.80%.
Kindergarten Correlation Summary
| Measurement | Lithuanian | African |
| Minimum | 97.5% | 94.9% |
| Maximum | 100.0% | 100.0% |
| Range | 2.5% | 5.1% |
| Mean | 99.4% | 98.5% |
| Median | 99.6% | 98.6% |
| Interquartile 25% (IQ1) | 99.0% | 97.8% |
| Interquartile 75% (IQ3) | 100.0% | 100.0% |
| Interquartile Range (IQR) | 1.0% | 2.2% |
| Standard Deviation (Sample) | 0.58% | 1.4% |
| Standard Deviation (Population) | 0.58% | 1.3% |
Similar Demographics by Kindergarten
Demographics Similar to Lithuanians by Kindergarten
In terms of kindergarten, the demographic groups most similar to Lithuanians are Pennsylvania German (98.6%, a difference of 0.0%), Finnish (98.6%, a difference of 0.0%), Arapaho (98.6%, a difference of 0.0%), Danish (98.6%, a difference of 0.0%), and Sioux (98.6%, a difference of 0.0%).
| Demographics | Rating | Rank | Kindergarten |
| English | 100.0 /100 | #14 | Exceptional 98.7% |
| Swedes | 100.0 /100 | #15 | Exceptional 98.7% |
| Aleuts | 100.0 /100 | #16 | Exceptional 98.6% |
| Scottish | 100.0 /100 | #17 | Exceptional 98.6% |
| Dutch | 100.0 /100 | #18 | Exceptional 98.6% |
| Irish | 100.0 /100 | #19 | Exceptional 98.6% |
| Pennsylvania Germans | 100.0 /100 | #20 | Exceptional 98.6% |
| Lithuanians | 100.0 /100 | #21 | Exceptional 98.6% |
| Finns | 100.0 /100 | #22 | Exceptional 98.6% |
| Arapaho | 100.0 /100 | #23 | Exceptional 98.6% |
| Danes | 100.0 /100 | #24 | Exceptional 98.6% |
| Sioux | 100.0 /100 | #25 | Exceptional 98.6% |
| Poles | 100.0 /100 | #26 | Exceptional 98.6% |
| Scotch-Irish | 100.0 /100 | #27 | Exceptional 98.6% |
| Croatians | 100.0 /100 | #28 | Exceptional 98.6% |
Demographics Similar to Africans by Kindergarten
In terms of kindergarten, the demographic groups most similar to Africans are Immigrants from Albania (97.8%, a difference of 0.0%), Immigrants from Uganda (97.8%, a difference of 0.010%), Immigrants from Chile (97.8%, a difference of 0.010%), Immigrants from Southern Europe (97.8%, a difference of 0.010%), and Immigrants from Lebanon (97.9%, a difference of 0.020%).
| Demographics | Rating | Rank | Kindergarten |
| Yuman | 21.6 /100 | #200 | Fair 97.9% |
| Immigrants | Lebanon | 20.9 /100 | #201 | Fair 97.9% |
| Immigrants | Ukraine | 19.1 /100 | #202 | Poor 97.8% |
| Immigrants | Uganda | 18.8 /100 | #203 | Poor 97.8% |
| Immigrants | Chile | 18.1 /100 | #204 | Poor 97.8% |
| Immigrants | Southern Europe | 18.0 /100 | #205 | Poor 97.8% |
| Immigrants | Albania | 16.4 /100 | #206 | Poor 97.8% |
| Africans | 16.1 /100 | #207 | Poor 97.8% |
| Immigrants | Northern Africa | 12.0 /100 | #208 | Poor 97.8% |
| Costa Ricans | 11.6 /100 | #209 | Poor 97.8% |
| Immigrants | Oceania | 11.1 /100 | #210 | Poor 97.8% |
| Laotians | 10.5 /100 | #211 | Poor 97.8% |
| Moroccans | 8.9 /100 | #212 | Tragic 97.8% |
| South American Indians | 7.7 /100 | #213 | Tragic 97.8% |
| Uruguayans | 7.5 /100 | #214 | Tragic 97.8% |