Liberian vs African Male Disability
COMPARE
Liberian
African
Male Disability
Male Disability Comparison
Liberians
Africans
11.8%
MALE DISABILITY
3.1/ 100
METRIC RATING
225th/ 347
METRIC RANK
12.6%
MALE DISABILITY
0.0/ 100
METRIC RATING
276th/ 347
METRIC RANK
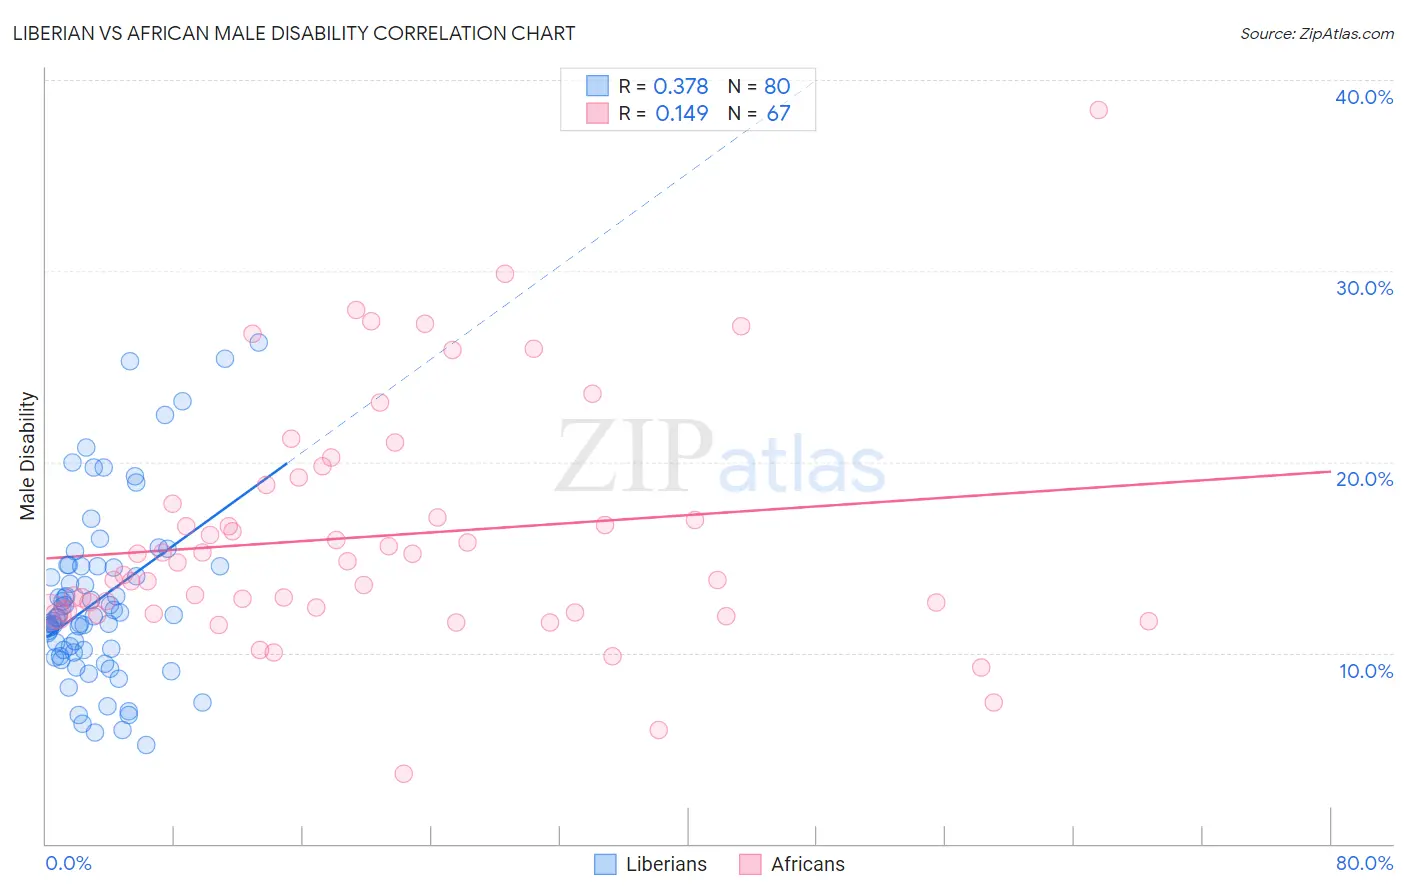
Liberian vs African Male Disability Correlation Chart
The statistical analysis conducted on geographies consisting of 118,082,647 people shows a mild positive correlation between the proportion of Liberians and percentage of males with a disability in the United States with a correlation coefficient (R) of 0.378 and weighted average of 11.8%. Similarly, the statistical analysis conducted on geographies consisting of 469,942,383 people shows a poor positive correlation between the proportion of Africans and percentage of males with a disability in the United States with a correlation coefficient (R) of 0.149 and weighted average of 12.6%, a difference of 7.0%.
Male Disability Correlation Summary
| Measurement | Liberian | African |
| Minimum | 5.2% | 3.6% |
| Maximum | 26.3% | 38.5% |
| Range | 21.1% | 34.8% |
| Mean | 12.8% | 16.1% |
| Median | 11.9% | 14.7% |
| Interquartile 25% (IQ1) | 10.1% | 12.1% |
| Interquartile 75% (IQ3) | 14.5% | 18.8% |
| Interquartile Range (IQR) | 4.5% | 6.7% |
| Standard Deviation (Sample) | 4.5% | 6.2% |
| Standard Deviation (Population) | 4.5% | 6.2% |
Similar Demographics by Male Disability
Demographics Similar to Liberians by Male Disability
In terms of male disability, the demographic groups most similar to Liberians are Japanese (11.7%, a difference of 0.010%), Immigrants from Bahamas (11.7%, a difference of 0.030%), Alsatian (11.7%, a difference of 0.12%), Subsaharan African (11.8%, a difference of 0.12%), and Immigrants from Congo (11.7%, a difference of 0.27%).
| Demographics | Rating | Rank | Male Disability |
| Immigrants | England | 4.0 /100 | #218 | Tragic 11.7% |
| Panamanians | 3.8 /100 | #219 | Tragic 11.7% |
| Immigrants | Western Europe | 3.8 /100 | #220 | Tragic 11.7% |
| Immigrants | Congo | 3.7 /100 | #221 | Tragic 11.7% |
| Alsatians | 3.3 /100 | #222 | Tragic 11.7% |
| Immigrants | Bahamas | 3.2 /100 | #223 | Tragic 11.7% |
| Japanese | 3.1 /100 | #224 | Tragic 11.7% |
| Liberians | 3.1 /100 | #225 | Tragic 11.8% |
| Sub-Saharan Africans | 2.8 /100 | #226 | Tragic 11.8% |
| Austrians | 2.5 /100 | #227 | Tragic 11.8% |
| Hispanics or Latinos | 2.3 /100 | #228 | Tragic 11.8% |
| Bermudans | 2.3 /100 | #229 | Tragic 11.8% |
| Croatians | 2.1 /100 | #230 | Tragic 11.8% |
| Dominicans | 1.8 /100 | #231 | Tragic 11.8% |
| Malaysians | 1.8 /100 | #232 | Tragic 11.8% |
Demographics Similar to Africans by Male Disability
In terms of male disability, the demographic groups most similar to Africans are Fijian (12.6%, a difference of 0.050%), Finnish (12.6%, a difference of 0.31%), Hopi (12.5%, a difference of 0.40%), Native Hawaiian (12.5%, a difference of 0.74%), and Hmong (12.5%, a difference of 0.80%).
| Demographics | Rating | Rank | Male Disability |
| Czechoslovakians | 0.1 /100 | #269 | Tragic 12.3% |
| Spaniards | 0.1 /100 | #270 | Tragic 12.3% |
| Scandinavians | 0.1 /100 | #271 | Tragic 12.3% |
| Hmong | 0.0 /100 | #272 | Tragic 12.5% |
| Native Hawaiians | 0.0 /100 | #273 | Tragic 12.5% |
| Hopi | 0.0 /100 | #274 | Tragic 12.5% |
| Fijians | 0.0 /100 | #275 | Tragic 12.6% |
| Africans | 0.0 /100 | #276 | Tragic 12.6% |
| Finns | 0.0 /100 | #277 | Tragic 12.6% |
| Central American Indians | 0.0 /100 | #278 | Tragic 12.7% |
| Slovaks | 0.0 /100 | #279 | Tragic 12.7% |
| Dutch | 0.0 /100 | #280 | Tragic 12.7% |
| Sioux | 0.0 /100 | #281 | Tragic 12.7% |
| Irish | 0.0 /100 | #282 | Tragic 12.7% |
| Germans | 0.0 /100 | #283 | Tragic 12.7% |