Liberian vs Immigrants from Cameroon Male Disability
COMPARE
Liberian
Immigrants from Cameroon
Male Disability
Male Disability Comparison
Liberians
Immigrants from Cameroon
11.8%
MALE DISABILITY
3.1/ 100
METRIC RATING
225th/ 347
METRIC RANK
10.5%
MALE DISABILITY
99.0/ 100
METRIC RATING
71st/ 347
METRIC RANK
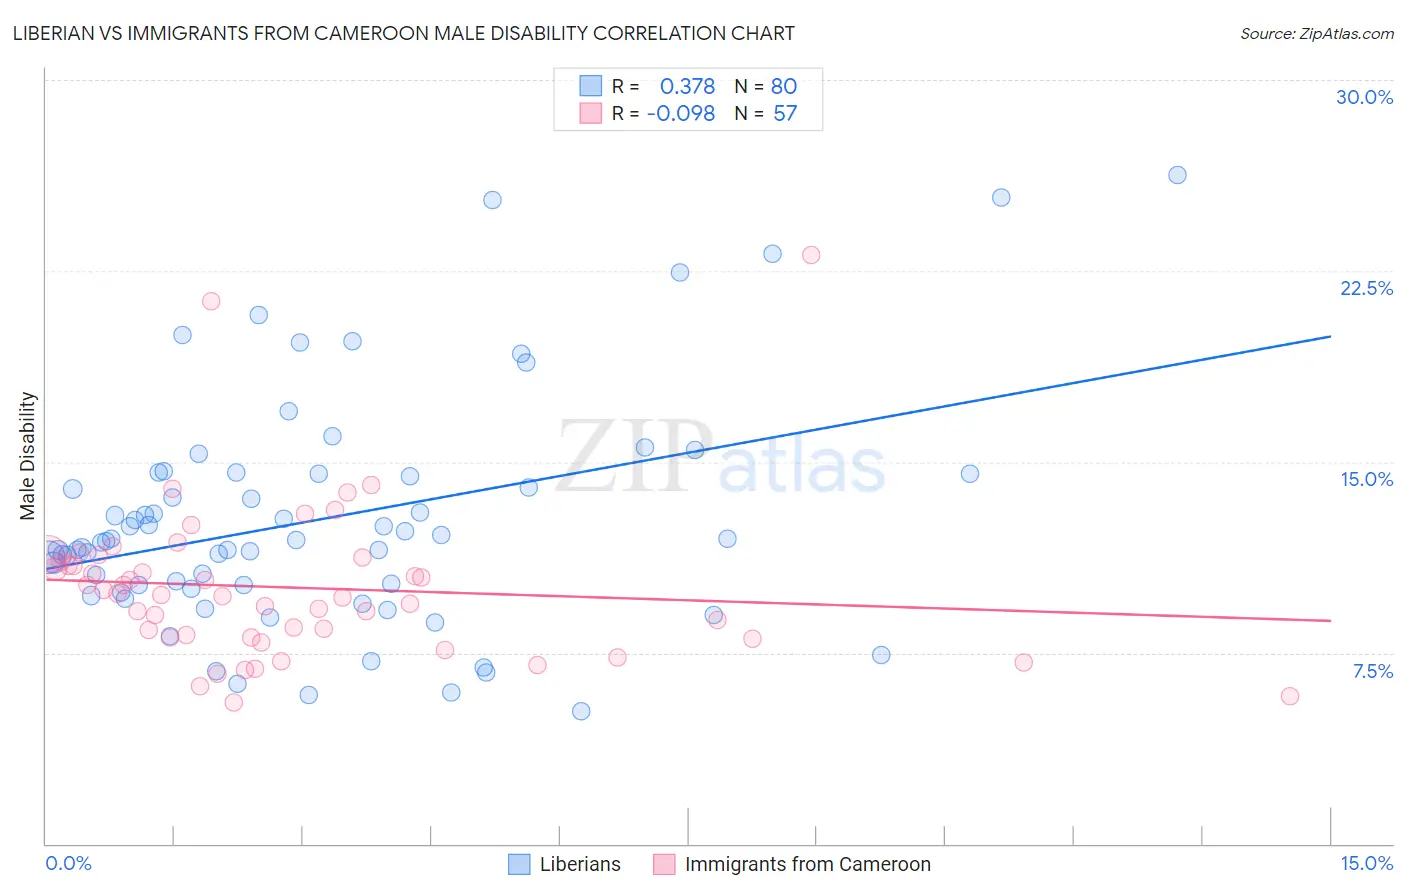
Liberian vs Immigrants from Cameroon Male Disability Correlation Chart
The statistical analysis conducted on geographies consisting of 118,082,647 people shows a mild positive correlation between the proportion of Liberians and percentage of males with a disability in the United States with a correlation coefficient (R) of 0.378 and weighted average of 11.8%. Similarly, the statistical analysis conducted on geographies consisting of 130,760,441 people shows a slight negative correlation between the proportion of Immigrants from Cameroon and percentage of males with a disability in the United States with a correlation coefficient (R) of -0.098 and weighted average of 10.5%, a difference of 11.9%.
Male Disability Correlation Summary
| Measurement | Liberian | Immigrants from Cameroon |
| Minimum | 5.2% | 5.6% |
| Maximum | 26.3% | 23.1% |
| Range | 21.1% | 17.6% |
| Mean | 12.8% | 10.1% |
| Median | 11.9% | 9.8% |
| Interquartile 25% (IQ1) | 10.1% | 8.1% |
| Interquartile 75% (IQ3) | 14.5% | 11.2% |
| Interquartile Range (IQR) | 4.5% | 3.1% |
| Standard Deviation (Sample) | 4.5% | 3.1% |
| Standard Deviation (Population) | 4.5% | 3.1% |
Similar Demographics by Male Disability
Demographics Similar to Liberians by Male Disability
In terms of male disability, the demographic groups most similar to Liberians are Japanese (11.7%, a difference of 0.010%), Immigrants from Bahamas (11.7%, a difference of 0.030%), Alsatian (11.7%, a difference of 0.12%), Subsaharan African (11.8%, a difference of 0.12%), and Immigrants from Congo (11.7%, a difference of 0.27%).
| Demographics | Rating | Rank | Male Disability |
| Immigrants | England | 4.0 /100 | #218 | Tragic 11.7% |
| Panamanians | 3.8 /100 | #219 | Tragic 11.7% |
| Immigrants | Western Europe | 3.8 /100 | #220 | Tragic 11.7% |
| Immigrants | Congo | 3.7 /100 | #221 | Tragic 11.7% |
| Alsatians | 3.3 /100 | #222 | Tragic 11.7% |
| Immigrants | Bahamas | 3.2 /100 | #223 | Tragic 11.7% |
| Japanese | 3.1 /100 | #224 | Tragic 11.7% |
| Liberians | 3.1 /100 | #225 | Tragic 11.8% |
| Sub-Saharan Africans | 2.8 /100 | #226 | Tragic 11.8% |
| Austrians | 2.5 /100 | #227 | Tragic 11.8% |
| Hispanics or Latinos | 2.3 /100 | #228 | Tragic 11.8% |
| Bermudans | 2.3 /100 | #229 | Tragic 11.8% |
| Croatians | 2.1 /100 | #230 | Tragic 11.8% |
| Dominicans | 1.8 /100 | #231 | Tragic 11.8% |
| Malaysians | 1.8 /100 | #232 | Tragic 11.8% |
Demographics Similar to Immigrants from Cameroon by Male Disability
In terms of male disability, the demographic groups most similar to Immigrants from Cameroon are Immigrants from Serbia (10.5%, a difference of 0.060%), Immigrants from Lithuania (10.5%, a difference of 0.12%), Immigrants from Bulgaria (10.5%, a difference of 0.15%), Immigrants from Lebanon (10.5%, a difference of 0.26%), and Colombian (10.5%, a difference of 0.29%).
| Demographics | Rating | Rank | Male Disability |
| Jordanians | 99.3 /100 | #64 | Exceptional 10.5% |
| Immigrants | Grenada | 99.2 /100 | #65 | Exceptional 10.5% |
| Guyanese | 99.2 /100 | #66 | Exceptional 10.5% |
| Immigrants | Afghanistan | 99.2 /100 | #67 | Exceptional 10.5% |
| Colombians | 99.2 /100 | #68 | Exceptional 10.5% |
| Ecuadorians | 99.2 /100 | #69 | Exceptional 10.5% |
| Immigrants | Bulgaria | 99.1 /100 | #70 | Exceptional 10.5% |
| Immigrants | Cameroon | 99.0 /100 | #71 | Exceptional 10.5% |
| Immigrants | Serbia | 99.0 /100 | #72 | Exceptional 10.5% |
| Immigrants | Lithuania | 98.9 /100 | #73 | Exceptional 10.5% |
| Immigrants | Lebanon | 98.8 /100 | #74 | Exceptional 10.5% |
| Sierra Leoneans | 98.7 /100 | #75 | Exceptional 10.5% |
| Immigrants | Sierra Leone | 98.7 /100 | #76 | Exceptional 10.5% |
| Laotians | 98.6 /100 | #77 | Exceptional 10.6% |
| Immigrants | Russia | 98.6 /100 | #78 | Exceptional 10.6% |