Cheyenne vs African Male Disability
COMPARE
Cheyenne
African
Male Disability
Male Disability Comparison
Cheyenne
Africans
13.0%
MALE DISABILITY
0.0/ 100
METRIC RATING
300th/ 347
METRIC RANK
12.6%
MALE DISABILITY
0.0/ 100
METRIC RATING
276th/ 347
METRIC RANK
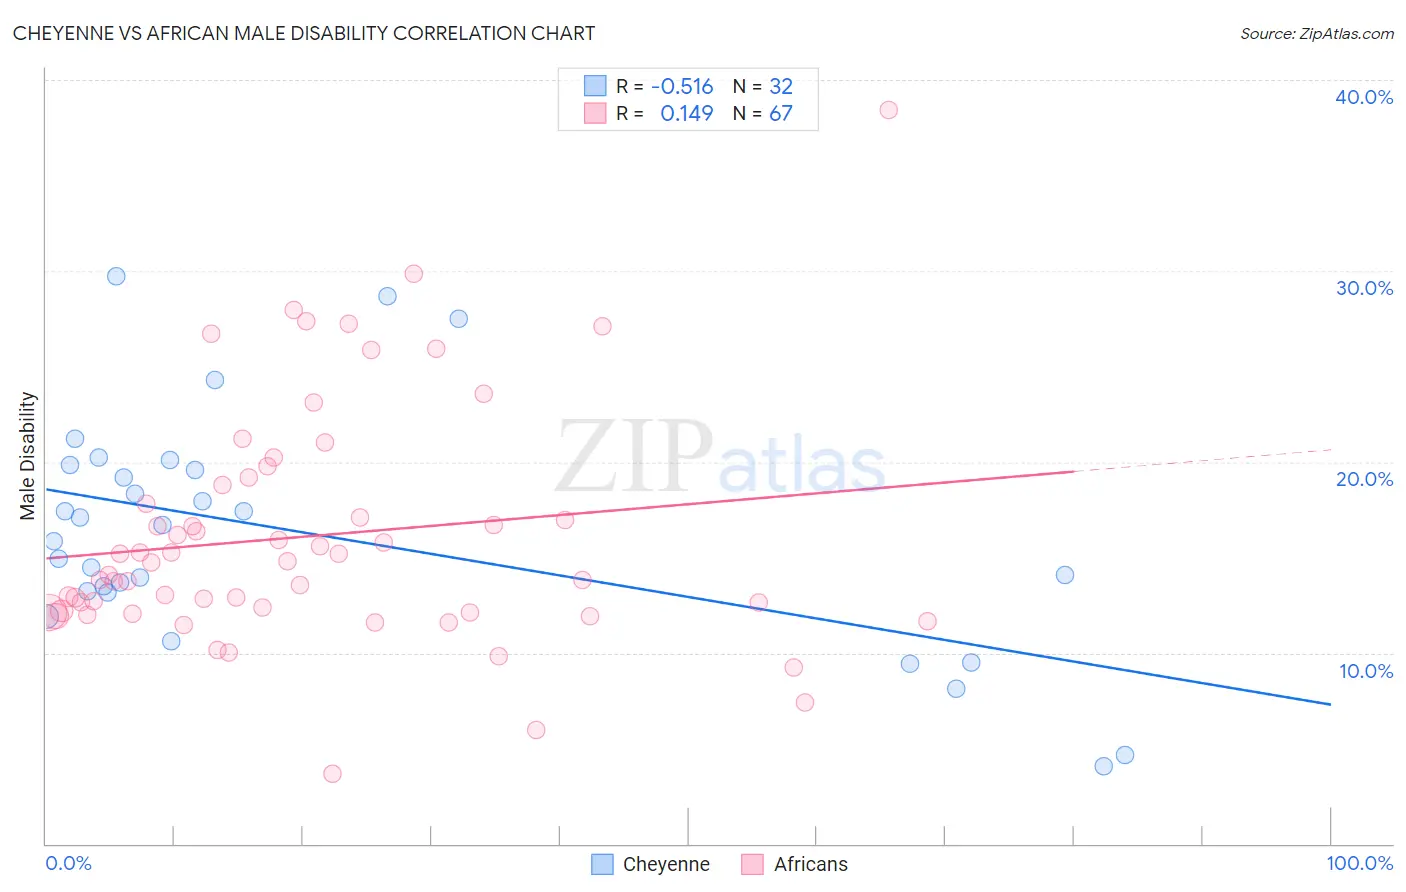
Cheyenne vs African Male Disability Correlation Chart
The statistical analysis conducted on geographies consisting of 80,709,657 people shows a substantial negative correlation between the proportion of Cheyenne and percentage of males with a disability in the United States with a correlation coefficient (R) of -0.516 and weighted average of 13.0%. Similarly, the statistical analysis conducted on geographies consisting of 469,942,383 people shows a poor positive correlation between the proportion of Africans and percentage of males with a disability in the United States with a correlation coefficient (R) of 0.149 and weighted average of 12.6%, a difference of 3.7%.
Male Disability Correlation Summary
| Measurement | Cheyenne | African |
| Minimum | 4.1% | 3.6% |
| Maximum | 29.8% | 38.5% |
| Range | 25.7% | 34.8% |
| Mean | 16.3% | 16.1% |
| Median | 16.2% | 14.7% |
| Interquartile 25% (IQ1) | 13.2% | 12.1% |
| Interquartile 75% (IQ3) | 19.7% | 18.8% |
| Interquartile Range (IQR) | 6.5% | 6.7% |
| Standard Deviation (Sample) | 6.1% | 6.2% |
| Standard Deviation (Population) | 6.0% | 6.2% |
Similar Demographics by Male Disability
Demographics Similar to Cheyenne by Male Disability
In terms of male disability, the demographic groups most similar to Cheyenne are French (13.0%, a difference of 0.040%), Celtic (13.0%, a difference of 0.090%), Pennsylvania German (13.0%, a difference of 0.44%), Crow (13.1%, a difference of 0.63%), and Inupiat (13.0%, a difference of 0.64%).
| Demographics | Rating | Rank | Male Disability |
| Yaqui | 0.0 /100 | #293 | Tragic 12.9% |
| Marshallese | 0.0 /100 | #294 | Tragic 12.9% |
| Immigrants | Micronesia | 0.0 /100 | #295 | Tragic 12.9% |
| Immigrants | Nonimmigrants | 0.0 /100 | #296 | Tragic 12.9% |
| Inupiat | 0.0 /100 | #297 | Tragic 13.0% |
| Pennsylvania Germans | 0.0 /100 | #298 | Tragic 13.0% |
| Celtics | 0.0 /100 | #299 | Tragic 13.0% |
| Cheyenne | 0.0 /100 | #300 | Tragic 13.0% |
| French | 0.0 /100 | #301 | Tragic 13.0% |
| Crow | 0.0 /100 | #302 | Tragic 13.1% |
| Scotch-Irish | 0.0 /100 | #303 | Tragic 13.2% |
| Blacks/African Americans | 0.0 /100 | #304 | Tragic 13.2% |
| French Canadians | 0.0 /100 | #305 | Tragic 13.3% |
| Spanish Americans | 0.0 /100 | #306 | Tragic 13.3% |
| Arapaho | 0.0 /100 | #307 | Tragic 13.3% |
Demographics Similar to Africans by Male Disability
In terms of male disability, the demographic groups most similar to Africans are Fijian (12.6%, a difference of 0.050%), Finnish (12.6%, a difference of 0.31%), Hopi (12.5%, a difference of 0.40%), Native Hawaiian (12.5%, a difference of 0.74%), and Hmong (12.5%, a difference of 0.80%).
| Demographics | Rating | Rank | Male Disability |
| Czechoslovakians | 0.1 /100 | #269 | Tragic 12.3% |
| Spaniards | 0.1 /100 | #270 | Tragic 12.3% |
| Scandinavians | 0.1 /100 | #271 | Tragic 12.3% |
| Hmong | 0.0 /100 | #272 | Tragic 12.5% |
| Native Hawaiians | 0.0 /100 | #273 | Tragic 12.5% |
| Hopi | 0.0 /100 | #274 | Tragic 12.5% |
| Fijians | 0.0 /100 | #275 | Tragic 12.6% |
| Africans | 0.0 /100 | #276 | Tragic 12.6% |
| Finns | 0.0 /100 | #277 | Tragic 12.6% |
| Central American Indians | 0.0 /100 | #278 | Tragic 12.7% |
| Slovaks | 0.0 /100 | #279 | Tragic 12.7% |
| Dutch | 0.0 /100 | #280 | Tragic 12.7% |
| Sioux | 0.0 /100 | #281 | Tragic 12.7% |
| Irish | 0.0 /100 | #282 | Tragic 12.7% |
| Germans | 0.0 /100 | #283 | Tragic 12.7% |