Liberian vs African Single Female Poverty
COMPARE
Liberian
African
Single Female Poverty
Single Female Poverty Comparison
Liberians
Africans
22.4%
SINGLE FEMALE POVERTY
1.4/ 100
METRIC RATING
246th/ 347
METRIC RANK
24.8%
SINGLE FEMALE POVERTY
0.0/ 100
METRIC RATING
296th/ 347
METRIC RANK
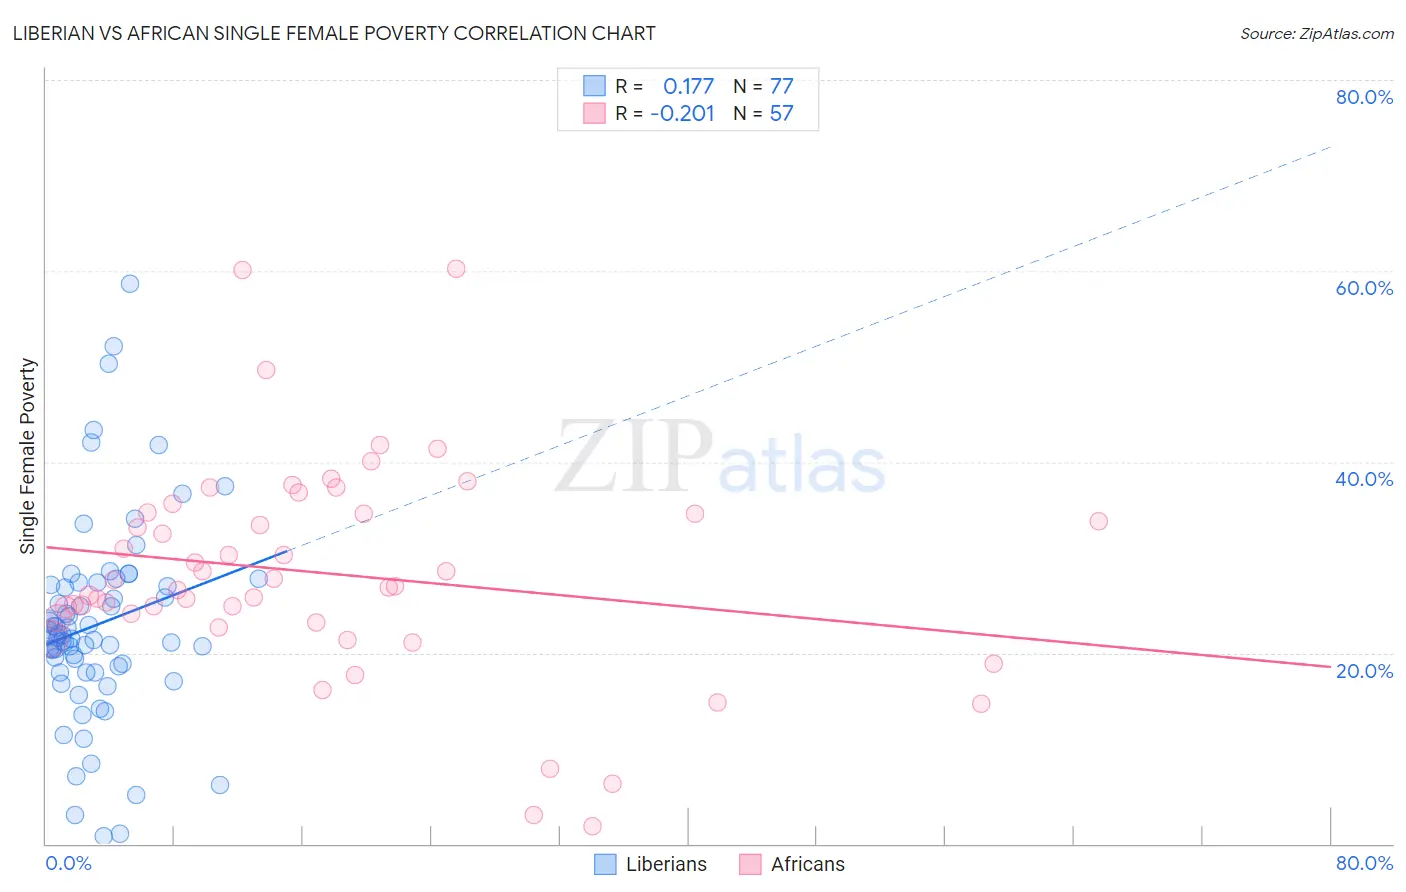
Liberian vs African Single Female Poverty Correlation Chart
The statistical analysis conducted on geographies consisting of 117,657,601 people shows a poor positive correlation between the proportion of Liberians and poverty level among single females in the United States with a correlation coefficient (R) of 0.177 and weighted average of 22.4%. Similarly, the statistical analysis conducted on geographies consisting of 463,525,497 people shows a weak negative correlation between the proportion of Africans and poverty level among single females in the United States with a correlation coefficient (R) of -0.201 and weighted average of 24.8%, a difference of 10.5%.
Single Female Poverty Correlation Summary
| Measurement | Liberian | African |
| Minimum | 0.74% | 1.9% |
| Maximum | 58.7% | 60.3% |
| Range | 58.0% | 58.4% |
| Mean | 23.0% | 28.3% |
| Median | 21.7% | 27.0% |
| Interquartile 25% (IQ1) | 18.3% | 23.4% |
| Interquartile 75% (IQ3) | 27.2% | 34.6% |
| Interquartile Range (IQR) | 9.0% | 11.2% |
| Standard Deviation (Sample) | 10.5% | 11.2% |
| Standard Deviation (Population) | 10.4% | 11.1% |
Similar Demographics by Single Female Poverty
Demographics Similar to Liberians by Single Female Poverty
In terms of single female poverty, the demographic groups most similar to Liberians are Immigrants from El Salvador (22.4%, a difference of 0.060%), Belizean (22.4%, a difference of 0.070%), Immigrants from Caribbean (22.4%, a difference of 0.17%), Immigrants from Bahamas (22.5%, a difference of 0.32%), and Immigrants from Bangladesh (22.3%, a difference of 0.37%).
| Demographics | Rating | Rank | Single Female Poverty |
| Malaysians | 2.8 /100 | #239 | Tragic 22.2% |
| French | 2.3 /100 | #240 | Tragic 22.2% |
| Cape Verdeans | 2.1 /100 | #241 | Tragic 22.3% |
| Bermudans | 2.0 /100 | #242 | Tragic 22.3% |
| West Indians | 1.9 /100 | #243 | Tragic 22.3% |
| Immigrants | Middle Africa | 1.9 /100 | #244 | Tragic 22.3% |
| Immigrants | Bangladesh | 1.8 /100 | #245 | Tragic 22.3% |
| Liberians | 1.4 /100 | #246 | Tragic 22.4% |
| Immigrants | El Salvador | 1.4 /100 | #247 | Tragic 22.4% |
| Belizeans | 1.4 /100 | #248 | Tragic 22.4% |
| Immigrants | Caribbean | 1.3 /100 | #249 | Tragic 22.4% |
| Immigrants | Bahamas | 1.2 /100 | #250 | Tragic 22.5% |
| Immigrants | West Indies | 1.0 /100 | #251 | Tragic 22.5% |
| Delaware | 1.0 /100 | #252 | Tragic 22.5% |
| Immigrants | Liberia | 0.9 /100 | #253 | Tragic 22.5% |
Demographics Similar to Africans by Single Female Poverty
In terms of single female poverty, the demographic groups most similar to Africans are Immigrants from Central America (24.8%, a difference of 0.28%), Hispanic or Latino (24.6%, a difference of 0.48%), Yaqui (24.9%, a difference of 0.48%), French American Indian (24.6%, a difference of 0.83%), and American (24.5%, a difference of 0.98%).
| Demographics | Rating | Rank | Single Female Poverty |
| U.S. Virgin Islanders | 0.0 /100 | #289 | Tragic 24.2% |
| Indonesians | 0.0 /100 | #290 | Tragic 24.3% |
| Osage | 0.0 /100 | #291 | Tragic 24.4% |
| Alsatians | 0.0 /100 | #292 | Tragic 24.5% |
| Americans | 0.0 /100 | #293 | Tragic 24.5% |
| French American Indians | 0.0 /100 | #294 | Tragic 24.6% |
| Hispanics or Latinos | 0.0 /100 | #295 | Tragic 24.6% |
| Africans | 0.0 /100 | #296 | Tragic 24.8% |
| Immigrants | Central America | 0.0 /100 | #297 | Tragic 24.8% |
| Yaqui | 0.0 /100 | #298 | Tragic 24.9% |
| Mexicans | 0.0 /100 | #299 | Tragic 25.0% |
| Blackfeet | 0.0 /100 | #300 | Tragic 25.1% |
| Hondurans | 0.0 /100 | #301 | Tragic 25.1% |
| Shoshone | 0.0 /100 | #302 | Tragic 25.1% |
| Somalis | 0.0 /100 | #303 | Tragic 25.2% |