Belizean vs African Male Disability
COMPARE
Belizean
African
Male Disability
Male Disability Comparison
Belizeans
Africans
11.4%
MALE DISABILITY
21.2/ 100
METRIC RATING
194th/ 347
METRIC RANK
12.6%
MALE DISABILITY
0.0/ 100
METRIC RATING
276th/ 347
METRIC RANK
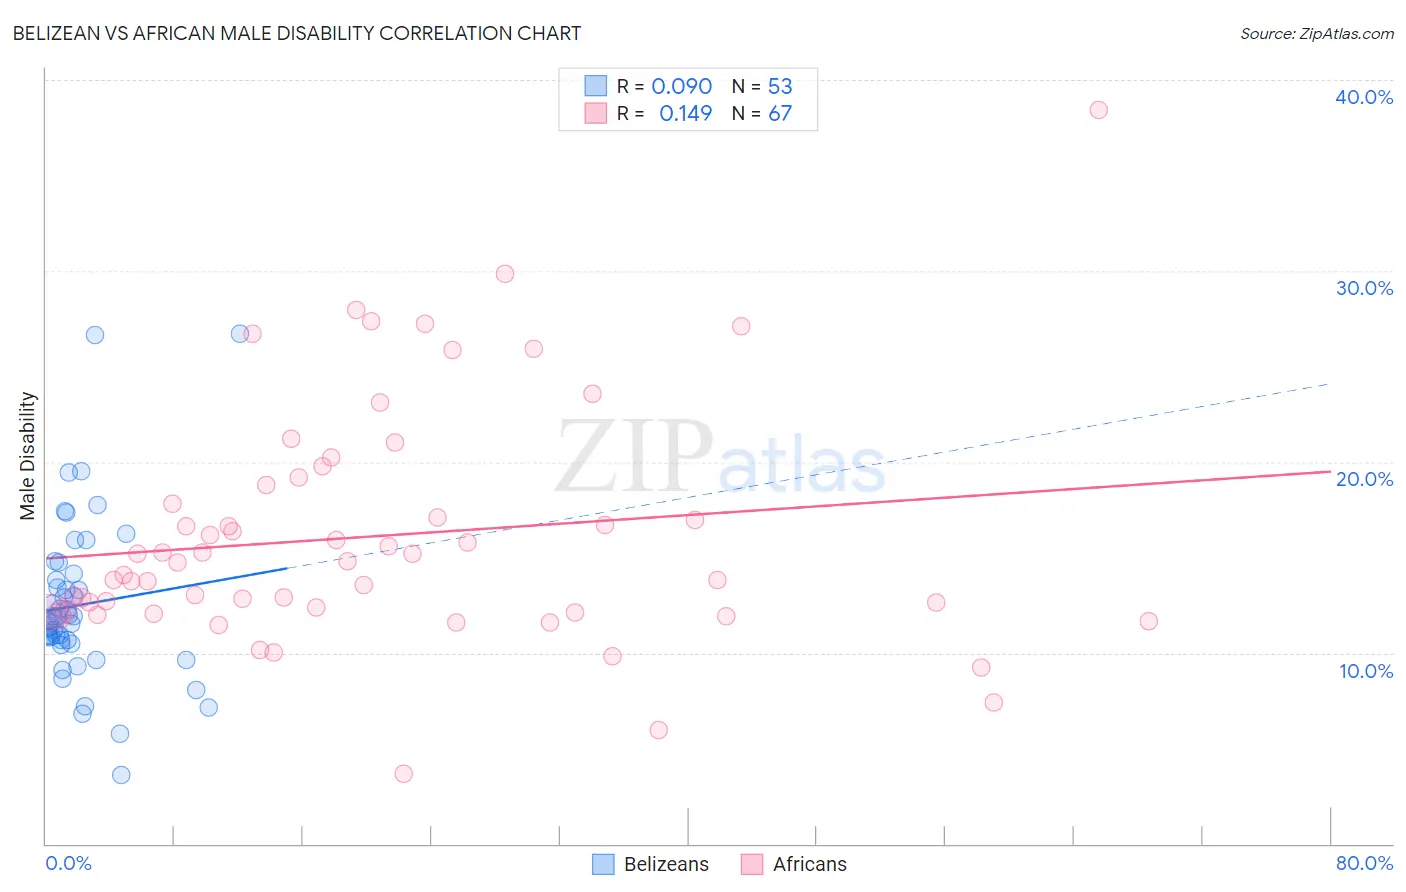
Belizean vs African Male Disability Correlation Chart
The statistical analysis conducted on geographies consisting of 144,197,719 people shows a slight positive correlation between the proportion of Belizeans and percentage of males with a disability in the United States with a correlation coefficient (R) of 0.090 and weighted average of 11.4%. Similarly, the statistical analysis conducted on geographies consisting of 469,942,383 people shows a poor positive correlation between the proportion of Africans and percentage of males with a disability in the United States with a correlation coefficient (R) of 0.149 and weighted average of 12.6%, a difference of 10.1%.
Male Disability Correlation Summary
| Measurement | Belizean | African |
| Minimum | 3.6% | 3.6% |
| Maximum | 26.7% | 38.5% |
| Range | 23.1% | 34.8% |
| Mean | 12.5% | 16.1% |
| Median | 11.6% | 14.7% |
| Interquartile 25% (IQ1) | 10.6% | 12.1% |
| Interquartile 75% (IQ3) | 14.0% | 18.8% |
| Interquartile Range (IQR) | 3.4% | 6.7% |
| Standard Deviation (Sample) | 4.3% | 6.2% |
| Standard Deviation (Population) | 4.2% | 6.2% |
Similar Demographics by Male Disability
Demographics Similar to Belizeans by Male Disability
In terms of male disability, the demographic groups most similar to Belizeans are Immigrants from Oceania (11.4%, a difference of 0.030%), Greek (11.4%, a difference of 0.080%), Assyrian/Chaldean/Syriac (11.4%, a difference of 0.15%), Senegalese (11.4%, a difference of 0.16%), and West Indian (11.4%, a difference of 0.24%).
| Demographics | Rating | Rank | Male Disability |
| Immigrants | Austria | 27.3 /100 | #187 | Fair 11.4% |
| Estonians | 26.8 /100 | #188 | Fair 11.4% |
| Immigrants | Netherlands | 25.9 /100 | #189 | Fair 11.4% |
| Immigrants | Bosnia and Herzegovina | 25.4 /100 | #190 | Fair 11.4% |
| Senegalese | 23.2 /100 | #191 | Fair 11.4% |
| Assyrians/Chaldeans/Syriacs | 23.2 /100 | #192 | Fair 11.4% |
| Greeks | 22.2 /100 | #193 | Fair 11.4% |
| Belizeans | 21.2 /100 | #194 | Fair 11.4% |
| Immigrants | Oceania | 20.9 /100 | #195 | Fair 11.4% |
| West Indians | 18.4 /100 | #196 | Poor 11.4% |
| Somalis | 18.2 /100 | #197 | Poor 11.4% |
| Immigrants | Jamaica | 16.3 /100 | #198 | Poor 11.5% |
| Lebanese | 15.4 /100 | #199 | Poor 11.5% |
| Immigrants | Iraq | 13.0 /100 | #200 | Poor 11.5% |
| Immigrants | Panama | 13.0 /100 | #201 | Poor 11.5% |
Demographics Similar to Africans by Male Disability
In terms of male disability, the demographic groups most similar to Africans are Fijian (12.6%, a difference of 0.050%), Finnish (12.6%, a difference of 0.31%), Hopi (12.5%, a difference of 0.40%), Native Hawaiian (12.5%, a difference of 0.74%), and Hmong (12.5%, a difference of 0.80%).
| Demographics | Rating | Rank | Male Disability |
| Czechoslovakians | 0.1 /100 | #269 | Tragic 12.3% |
| Spaniards | 0.1 /100 | #270 | Tragic 12.3% |
| Scandinavians | 0.1 /100 | #271 | Tragic 12.3% |
| Hmong | 0.0 /100 | #272 | Tragic 12.5% |
| Native Hawaiians | 0.0 /100 | #273 | Tragic 12.5% |
| Hopi | 0.0 /100 | #274 | Tragic 12.5% |
| Fijians | 0.0 /100 | #275 | Tragic 12.6% |
| Africans | 0.0 /100 | #276 | Tragic 12.6% |
| Finns | 0.0 /100 | #277 | Tragic 12.6% |
| Central American Indians | 0.0 /100 | #278 | Tragic 12.7% |
| Slovaks | 0.0 /100 | #279 | Tragic 12.7% |
| Dutch | 0.0 /100 | #280 | Tragic 12.7% |
| Sioux | 0.0 /100 | #281 | Tragic 12.7% |
| Irish | 0.0 /100 | #282 | Tragic 12.7% |
| Germans | 0.0 /100 | #283 | Tragic 12.7% |