Liberian vs African In Labor Force | Age 16-19
COMPARE
Liberian
African
In Labor Force | Age 16-19
In Labor Force | Age 16-19 Comparison
Liberians
Africans
41.8%
IN LABOR FORCE | AGE 16-19
100.0/ 100
METRIC RATING
33rd/ 347
METRIC RANK
38.0%
IN LABOR FORCE | AGE 16-19
95.6/ 100
METRIC RATING
126th/ 347
METRIC RANK
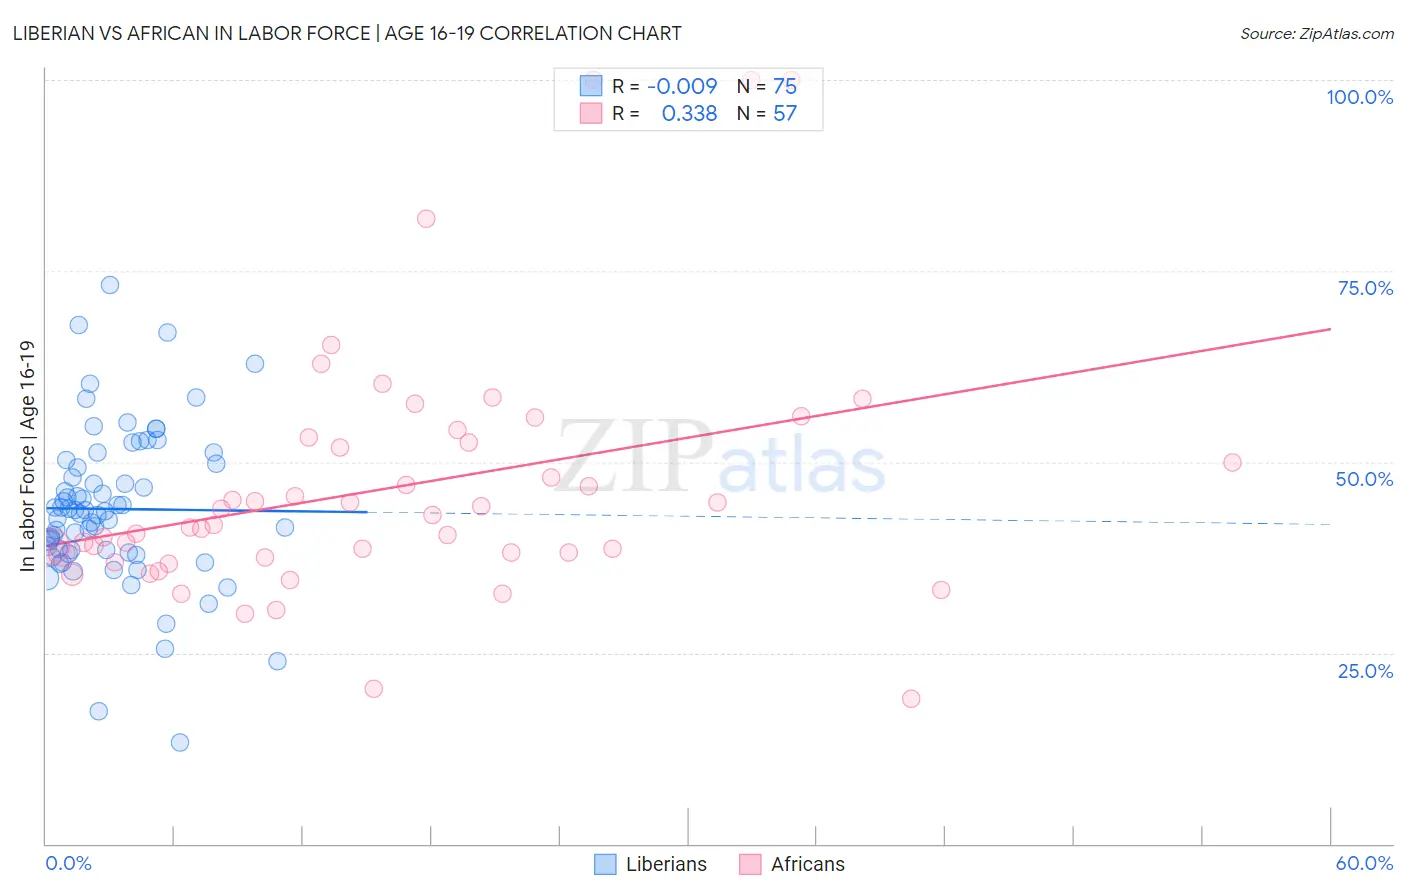
Liberian vs African In Labor Force | Age 16-19 Correlation Chart
The statistical analysis conducted on geographies consisting of 118,043,007 people shows no correlation between the proportion of Liberians and labor force participation rate among population between the ages 16 and 19 in the United States with a correlation coefficient (R) of -0.009 and weighted average of 41.8%. Similarly, the statistical analysis conducted on geographies consisting of 469,169,744 people shows a mild positive correlation between the proportion of Africans and labor force participation rate among population between the ages 16 and 19 in the United States with a correlation coefficient (R) of 0.338 and weighted average of 38.0%, a difference of 10.1%.
In Labor Force | Age 16-19 Correlation Summary
| Measurement | Liberian | African |
| Minimum | 13.3% | 19.0% |
| Maximum | 73.2% | 100.0% |
| Range | 59.9% | 81.0% |
| Mean | 43.8% | 46.7% |
| Median | 43.6% | 41.8% |
| Interquartile 25% (IQ1) | 38.1% | 37.8% |
| Interquartile 75% (IQ3) | 49.7% | 52.9% |
| Interquartile Range (IQR) | 11.6% | 15.1% |
| Standard Deviation (Sample) | 10.3% | 16.6% |
| Standard Deviation (Population) | 10.2% | 16.5% |
Similar Demographics by In Labor Force | Age 16-19
Demographics Similar to Liberians by In Labor Force | Age 16-19
In terms of in labor force | age 16-19, the demographic groups most similar to Liberians are Immigrants from Bosnia and Herzegovina (41.8%, a difference of 0.080%), Yugoslavian (41.8%, a difference of 0.10%), Czechoslovakian (41.9%, a difference of 0.14%), Immigrants from the Azores (41.7%, a difference of 0.24%), and Immigrants from Congo (41.7%, a difference of 0.32%).
| Demographics | Rating | Rank | In Labor Force | Age 16-19 |
| English | 100.0 /100 | #26 | Exceptional 42.4% |
| Welsh | 100.0 /100 | #27 | Exceptional 42.3% |
| Poles | 100.0 /100 | #28 | Exceptional 42.1% |
| French | 100.0 /100 | #29 | Exceptional 42.1% |
| Scottish | 100.0 /100 | #30 | Exceptional 42.0% |
| Irish | 100.0 /100 | #31 | Exceptional 42.0% |
| Czechoslovakians | 100.0 /100 | #32 | Exceptional 41.9% |
| Liberians | 100.0 /100 | #33 | Exceptional 41.8% |
| Immigrants | Bosnia and Herzegovina | 100.0 /100 | #34 | Exceptional 41.8% |
| Yugoslavians | 100.0 /100 | #35 | Exceptional 41.8% |
| Immigrants | Azores | 100.0 /100 | #36 | Exceptional 41.7% |
| Immigrants | Congo | 100.0 /100 | #37 | Exceptional 41.7% |
| Sioux | 100.0 /100 | #38 | Exceptional 41.5% |
| Scotch-Irish | 100.0 /100 | #39 | Exceptional 41.5% |
| Immigrants | Liberia | 100.0 /100 | #40 | Exceptional 41.5% |
Demographics Similar to Africans by In Labor Force | Age 16-19
In terms of in labor force | age 16-19, the demographic groups most similar to Africans are Choctaw (38.0%, a difference of 0.010%), New Zealander (38.0%, a difference of 0.010%), Spaniard (38.0%, a difference of 0.030%), Immigrants from Zimbabwe (38.0%, a difference of 0.060%), and Immigrants from Africa (38.0%, a difference of 0.16%).
| Demographics | Rating | Rank | In Labor Force | Age 16-19 |
| Assyrians/Chaldeans/Syriacs | 97.8 /100 | #119 | Exceptional 38.3% |
| Ukrainians | 97.6 /100 | #120 | Exceptional 38.3% |
| Ethiopians | 97.4 /100 | #121 | Exceptional 38.2% |
| Guamanians/Chamorros | 97.4 /100 | #122 | Exceptional 38.2% |
| Seminole | 96.7 /100 | #123 | Exceptional 38.1% |
| Immigrants | England | 96.4 /100 | #124 | Exceptional 38.1% |
| Immigrants | Africa | 96.1 /100 | #125 | Exceptional 38.0% |
| Africans | 95.6 /100 | #126 | Exceptional 38.0% |
| Choctaw | 95.6 /100 | #127 | Exceptional 38.0% |
| New Zealanders | 95.6 /100 | #128 | Exceptional 38.0% |
| Spaniards | 95.5 /100 | #129 | Exceptional 38.0% |
| Immigrants | Zimbabwe | 95.4 /100 | #130 | Exceptional 38.0% |
| Immigrants | Austria | 95.0 /100 | #131 | Exceptional 37.9% |
| Immigrants | Oceania | 94.7 /100 | #132 | Exceptional 37.9% |
| Cheyenne | 94.6 /100 | #133 | Exceptional 37.9% |