Burmese vs African Male Disability
COMPARE
Burmese
African
Male Disability
Male Disability Comparison
Burmese
Africans
10.0%
MALE DISABILITY
100.0/ 100
METRIC RATING
21st/ 347
METRIC RANK
12.6%
MALE DISABILITY
0.0/ 100
METRIC RATING
276th/ 347
METRIC RANK
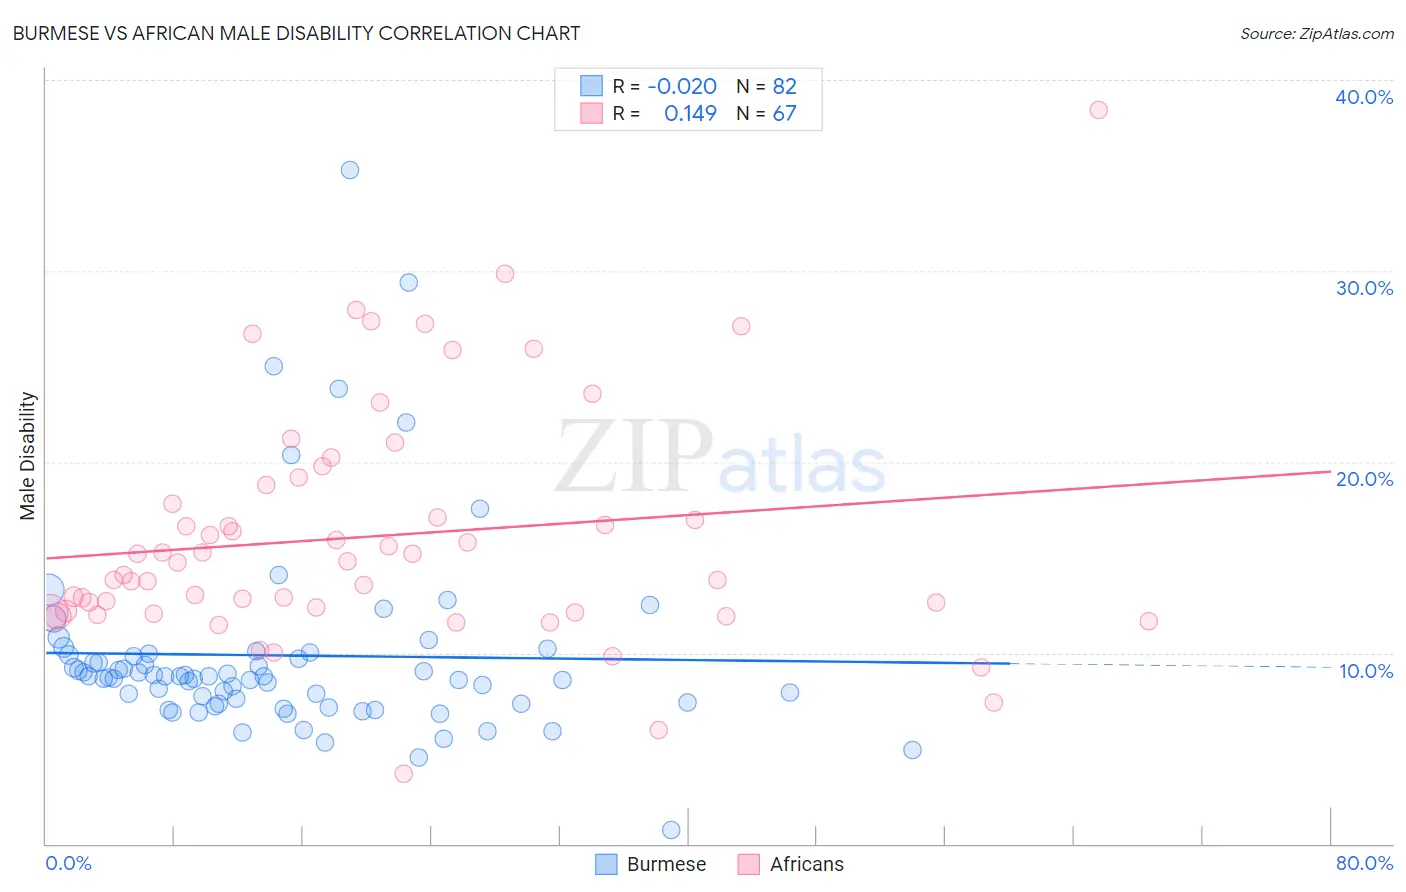
Burmese vs African Male Disability Correlation Chart
The statistical analysis conducted on geographies consisting of 465,271,159 people shows no correlation between the proportion of Burmese and percentage of males with a disability in the United States with a correlation coefficient (R) of -0.020 and weighted average of 10.0%. Similarly, the statistical analysis conducted on geographies consisting of 469,942,383 people shows a poor positive correlation between the proportion of Africans and percentage of males with a disability in the United States with a correlation coefficient (R) of 0.149 and weighted average of 12.6%, a difference of 26.0%.
Male Disability Correlation Summary
| Measurement | Burmese | African |
| Minimum | 0.74% | 3.6% |
| Maximum | 35.3% | 38.5% |
| Range | 34.6% | 34.8% |
| Mean | 9.9% | 16.1% |
| Median | 8.8% | 14.7% |
| Interquartile 25% (IQ1) | 7.3% | 12.1% |
| Interquartile 75% (IQ3) | 9.9% | 18.8% |
| Interquartile Range (IQR) | 2.6% | 6.7% |
| Standard Deviation (Sample) | 5.2% | 6.2% |
| Standard Deviation (Population) | 5.2% | 6.2% |
Similar Demographics by Male Disability
Demographics Similar to Burmese by Male Disability
In terms of male disability, the demographic groups most similar to Burmese are Asian (10.0%, a difference of 0.11%), Immigrants from Sri Lanka (10.0%, a difference of 0.16%), Immigrants from Venezuela (10.0%, a difference of 0.29%), Cypriot (10.0%, a difference of 0.38%), and Immigrants from Asia (10.0%, a difference of 0.51%).
| Demographics | Rating | Rank | Male Disability |
| Immigrants | Iran | 100.0 /100 | #14 | Exceptional 9.7% |
| Indians (Asian) | 100.0 /100 | #15 | Exceptional 9.7% |
| Okinawans | 100.0 /100 | #16 | Exceptional 9.8% |
| Immigrants | Korea | 100.0 /100 | #17 | Exceptional 9.8% |
| Immigrants | Pakistan | 100.0 /100 | #18 | Exceptional 9.8% |
| Immigrants | Sri Lanka | 100.0 /100 | #19 | Exceptional 10.0% |
| Asians | 100.0 /100 | #20 | Exceptional 10.0% |
| Burmese | 100.0 /100 | #21 | Exceptional 10.0% |
| Immigrants | Venezuela | 100.0 /100 | #22 | Exceptional 10.0% |
| Cypriots | 100.0 /100 | #23 | Exceptional 10.0% |
| Immigrants | Asia | 100.0 /100 | #24 | Exceptional 10.0% |
| Immigrants | Malaysia | 99.9 /100 | #25 | Exceptional 10.0% |
| Paraguayans | 99.9 /100 | #26 | Exceptional 10.1% |
| Egyptians | 99.9 /100 | #27 | Exceptional 10.1% |
| Vietnamese | 99.9 /100 | #28 | Exceptional 10.1% |
Demographics Similar to Africans by Male Disability
In terms of male disability, the demographic groups most similar to Africans are Fijian (12.6%, a difference of 0.050%), Finnish (12.6%, a difference of 0.31%), Hopi (12.5%, a difference of 0.40%), Native Hawaiian (12.5%, a difference of 0.74%), and Hmong (12.5%, a difference of 0.80%).
| Demographics | Rating | Rank | Male Disability |
| Czechoslovakians | 0.1 /100 | #269 | Tragic 12.3% |
| Spaniards | 0.1 /100 | #270 | Tragic 12.3% |
| Scandinavians | 0.1 /100 | #271 | Tragic 12.3% |
| Hmong | 0.0 /100 | #272 | Tragic 12.5% |
| Native Hawaiians | 0.0 /100 | #273 | Tragic 12.5% |
| Hopi | 0.0 /100 | #274 | Tragic 12.5% |
| Fijians | 0.0 /100 | #275 | Tragic 12.6% |
| Africans | 0.0 /100 | #276 | Tragic 12.6% |
| Finns | 0.0 /100 | #277 | Tragic 12.6% |
| Central American Indians | 0.0 /100 | #278 | Tragic 12.7% |
| Slovaks | 0.0 /100 | #279 | Tragic 12.7% |
| Dutch | 0.0 /100 | #280 | Tragic 12.7% |
| Sioux | 0.0 /100 | #281 | Tragic 12.7% |
| Irish | 0.0 /100 | #282 | Tragic 12.7% |
| Germans | 0.0 /100 | #283 | Tragic 12.7% |