Immigrants from Uzbekistan vs African Male Disability
COMPARE
Immigrants from Uzbekistan
African
Male Disability
Male Disability Comparison
Immigrants from Uzbekistan
Africans
10.4%
MALE DISABILITY
99.6/ 100
METRIC RATING
53rd/ 347
METRIC RANK
12.6%
MALE DISABILITY
0.0/ 100
METRIC RATING
276th/ 347
METRIC RANK
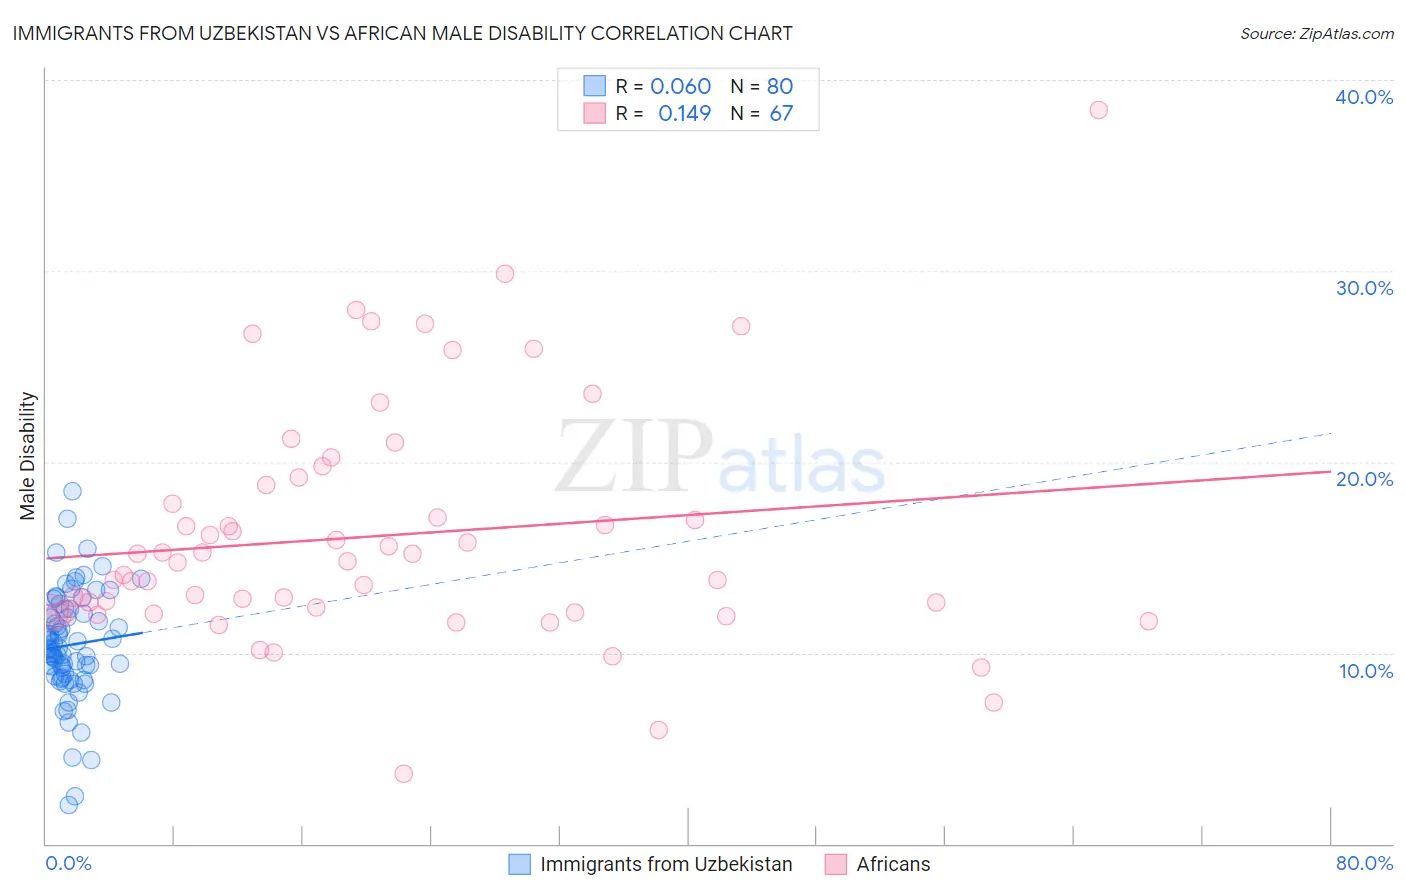
Immigrants from Uzbekistan vs African Male Disability Correlation Chart
The statistical analysis conducted on geographies consisting of 118,722,579 people shows a slight positive correlation between the proportion of Immigrants from Uzbekistan and percentage of males with a disability in the United States with a correlation coefficient (R) of 0.060 and weighted average of 10.4%. Similarly, the statistical analysis conducted on geographies consisting of 469,942,383 people shows a poor positive correlation between the proportion of Africans and percentage of males with a disability in the United States with a correlation coefficient (R) of 0.149 and weighted average of 12.6%, a difference of 21.3%.
Male Disability Correlation Summary
| Measurement | Immigrants from Uzbekistan | African |
| Minimum | 2.0% | 3.6% |
| Maximum | 18.4% | 38.5% |
| Range | 16.4% | 34.8% |
| Mean | 10.4% | 16.1% |
| Median | 10.2% | 14.7% |
| Interquartile 25% (IQ1) | 8.8% | 12.1% |
| Interquartile 75% (IQ3) | 12.2% | 18.8% |
| Interquartile Range (IQR) | 3.4% | 6.7% |
| Standard Deviation (Sample) | 2.9% | 6.2% |
| Standard Deviation (Population) | 2.8% | 6.2% |
Similar Demographics by Male Disability
Demographics Similar to Immigrants from Uzbekistan by Male Disability
In terms of male disability, the demographic groups most similar to Immigrants from Uzbekistan are Immigrants from Saudi Arabia (10.4%, a difference of 0.020%), Salvadoran (10.4%, a difference of 0.040%), Peruvian (10.4%, a difference of 0.040%), Immigrants from Eritrea (10.4%, a difference of 0.060%), and Tongan (10.4%, a difference of 0.10%).
| Demographics | Rating | Rank | Male Disability |
| Cambodians | 99.7 /100 | #46 | Exceptional 10.3% |
| Immigrants | Peru | 99.7 /100 | #47 | Exceptional 10.3% |
| Israelis | 99.7 /100 | #48 | Exceptional 10.3% |
| Immigrants | Spain | 99.7 /100 | #49 | Exceptional 10.3% |
| South Americans | 99.6 /100 | #50 | Exceptional 10.3% |
| Salvadorans | 99.6 /100 | #51 | Exceptional 10.4% |
| Immigrants | Saudi Arabia | 99.6 /100 | #52 | Exceptional 10.4% |
| Immigrants | Uzbekistan | 99.6 /100 | #53 | Exceptional 10.4% |
| Peruvians | 99.6 /100 | #54 | Exceptional 10.4% |
| Immigrants | Eritrea | 99.6 /100 | #55 | Exceptional 10.4% |
| Tongans | 99.6 /100 | #56 | Exceptional 10.4% |
| Immigrants | South America | 99.6 /100 | #57 | Exceptional 10.4% |
| Immigrants | Japan | 99.5 /100 | #58 | Exceptional 10.4% |
| Immigrants | Australia | 99.5 /100 | #59 | Exceptional 10.4% |
| Immigrants | Colombia | 99.5 /100 | #60 | Exceptional 10.4% |
Demographics Similar to Africans by Male Disability
In terms of male disability, the demographic groups most similar to Africans are Fijian (12.6%, a difference of 0.050%), Finnish (12.6%, a difference of 0.31%), Hopi (12.5%, a difference of 0.40%), Native Hawaiian (12.5%, a difference of 0.74%), and Hmong (12.5%, a difference of 0.80%).
| Demographics | Rating | Rank | Male Disability |
| Czechoslovakians | 0.1 /100 | #269 | Tragic 12.3% |
| Spaniards | 0.1 /100 | #270 | Tragic 12.3% |
| Scandinavians | 0.1 /100 | #271 | Tragic 12.3% |
| Hmong | 0.0 /100 | #272 | Tragic 12.5% |
| Native Hawaiians | 0.0 /100 | #273 | Tragic 12.5% |
| Hopi | 0.0 /100 | #274 | Tragic 12.5% |
| Fijians | 0.0 /100 | #275 | Tragic 12.6% |
| Africans | 0.0 /100 | #276 | Tragic 12.6% |
| Finns | 0.0 /100 | #277 | Tragic 12.6% |
| Central American Indians | 0.0 /100 | #278 | Tragic 12.7% |
| Slovaks | 0.0 /100 | #279 | Tragic 12.7% |
| Dutch | 0.0 /100 | #280 | Tragic 12.7% |
| Sioux | 0.0 /100 | #281 | Tragic 12.7% |
| Irish | 0.0 /100 | #282 | Tragic 12.7% |
| Germans | 0.0 /100 | #283 | Tragic 12.7% |