Japanese vs Thai Self-Care Disability
COMPARE
Japanese
Thai
Self-Care Disability
Self-Care Disability Comparison
Japanese
Thais
2.7%
SELF-CARE DISABILITY
0.1/ 100
METRIC RATING
276th/ 347
METRIC RANK
2.1%
SELF-CARE DISABILITY
100.0/ 100
METRIC RATING
3rd/ 347
METRIC RANK
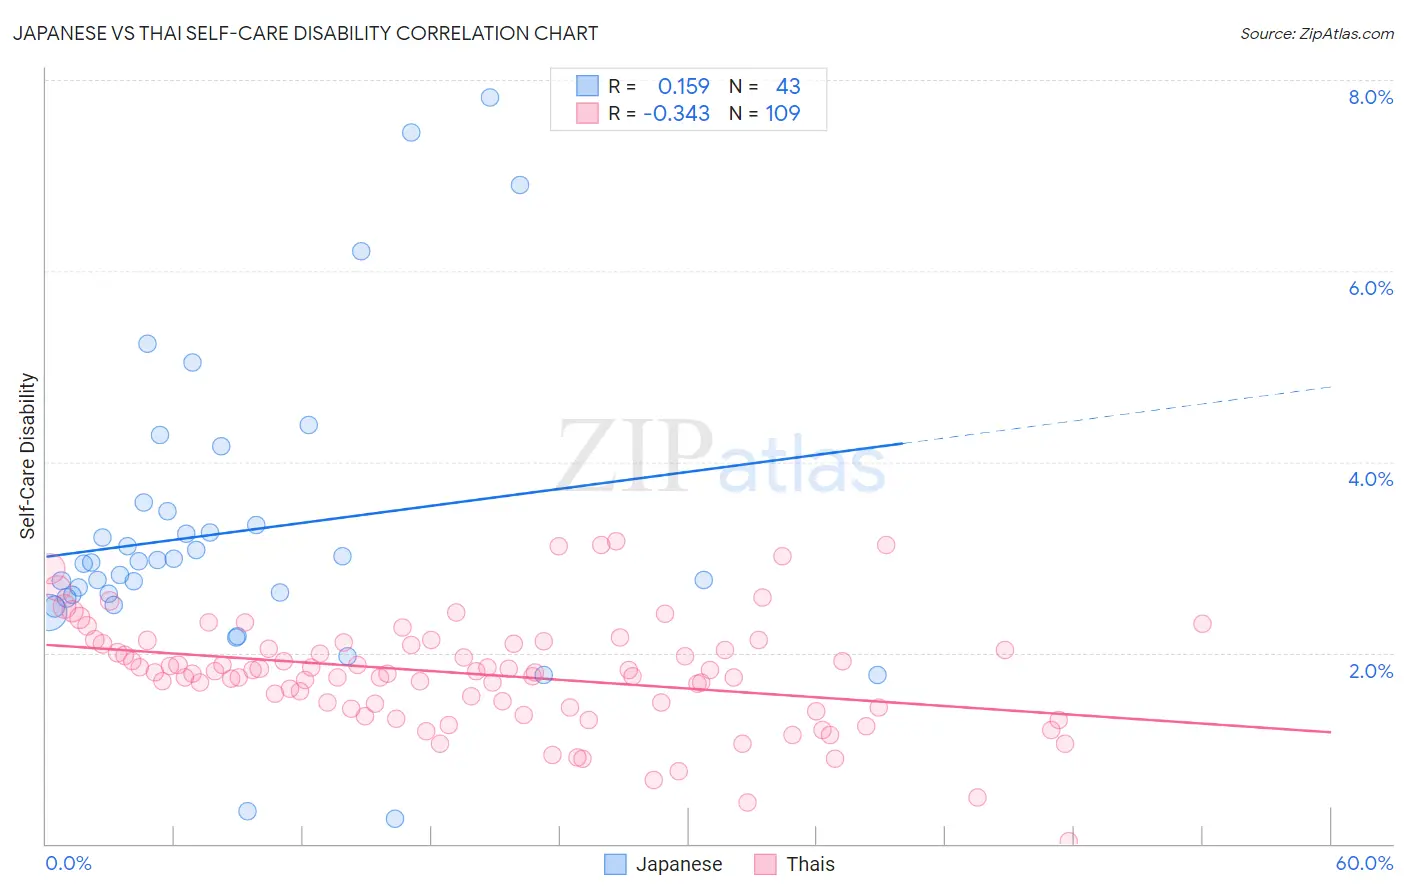
Japanese vs Thai Self-Care Disability Correlation Chart
The statistical analysis conducted on geographies consisting of 249,013,660 people shows a poor positive correlation between the proportion of Japanese and percentage of population with self-care disability in the United States with a correlation coefficient (R) of 0.159 and weighted average of 2.7%. Similarly, the statistical analysis conducted on geographies consisting of 474,998,821 people shows a mild negative correlation between the proportion of Thais and percentage of population with self-care disability in the United States with a correlation coefficient (R) of -0.343 and weighted average of 2.1%, a difference of 28.8%.
Self-Care Disability Correlation Summary
| Measurement | Japanese | Thai |
| Minimum | 0.26% | 0.030% |
| Maximum | 7.8% | 3.2% |
| Range | 7.6% | 3.1% |
| Mean | 3.3% | 1.8% |
| Median | 2.9% | 1.8% |
| Interquartile 25% (IQ1) | 2.6% | 1.4% |
| Interquartile 75% (IQ3) | 3.5% | 2.1% |
| Interquartile Range (IQR) | 0.91% | 0.67% |
| Standard Deviation (Sample) | 1.6% | 0.57% |
| Standard Deviation (Population) | 1.5% | 0.57% |
Similar Demographics by Self-Care Disability
Demographics Similar to Japanese by Self-Care Disability
In terms of self-care disability, the demographic groups most similar to Japanese are Immigrants from Ukraine (2.7%, a difference of 0.060%), Yakama (2.7%, a difference of 0.13%), Immigrants from Trinidad and Tobago (2.7%, a difference of 0.13%), Ottawa (2.7%, a difference of 0.14%), and Mexican (2.7%, a difference of 0.19%).
| Demographics | Rating | Rank | Self-Care Disability |
| U.S. Virgin Islanders | 0.1 /100 | #269 | Tragic 2.7% |
| Immigrants | Micronesia | 0.1 /100 | #270 | Tragic 2.7% |
| Trinidadians and Tobagonians | 0.1 /100 | #271 | Tragic 2.7% |
| Immigrants | Laos | 0.1 /100 | #272 | Tragic 2.7% |
| Mexicans | 0.1 /100 | #273 | Tragic 2.7% |
| Yakama | 0.1 /100 | #274 | Tragic 2.7% |
| Immigrants | Trinidad and Tobago | 0.1 /100 | #275 | Tragic 2.7% |
| Japanese | 0.1 /100 | #276 | Tragic 2.7% |
| Immigrants | Ukraine | 0.1 /100 | #277 | Tragic 2.7% |
| Ottawa | 0.1 /100 | #278 | Tragic 2.7% |
| Iroquois | 0.1 /100 | #279 | Tragic 2.7% |
| Hispanics or Latinos | 0.1 /100 | #280 | Tragic 2.7% |
| Immigrants | Iraq | 0.0 /100 | #281 | Tragic 2.7% |
| Apache | 0.0 /100 | #282 | Tragic 2.7% |
| Delaware | 0.0 /100 | #283 | Tragic 2.7% |
Demographics Similar to Thais by Self-Care Disability
In terms of self-care disability, the demographic groups most similar to Thais are Immigrants from Singapore (2.1%, a difference of 2.3%), Immigrants from India (2.0%, a difference of 3.0%), Zimbabwean (2.2%, a difference of 3.3%), Filipino (2.2%, a difference of 3.6%), and Immigrants from Bolivia (2.2%, a difference of 3.8%).
| Demographics | Rating | Rank | Self-Care Disability |
| Yup'ik | 100.0 /100 | #1 | Exceptional 1.9% |
| Immigrants | India | 100.0 /100 | #2 | Exceptional 2.0% |
| Thais | 100.0 /100 | #3 | Exceptional 2.1% |
| Immigrants | Singapore | 100.0 /100 | #4 | Exceptional 2.1% |
| Zimbabweans | 100.0 /100 | #5 | Exceptional 2.2% |
| Filipinos | 100.0 /100 | #6 | Exceptional 2.2% |
| Immigrants | Bolivia | 100.0 /100 | #7 | Exceptional 2.2% |
| Bolivians | 100.0 /100 | #8 | Exceptional 2.2% |
| Immigrants | Nepal | 100.0 /100 | #9 | Exceptional 2.2% |
| Sudanese | 100.0 /100 | #10 | Exceptional 2.2% |
| Immigrants | South Central Asia | 100.0 /100 | #11 | Exceptional 2.2% |
| Immigrants | Ethiopia | 100.0 /100 | #12 | Exceptional 2.2% |
| Ethiopians | 100.0 /100 | #13 | Exceptional 2.2% |
| Luxembourgers | 100.0 /100 | #14 | Exceptional 2.2% |
| Okinawans | 100.0 /100 | #15 | Exceptional 2.2% |