Japanese vs Norwegian Self-Care Disability
COMPARE
Japanese
Norwegian
Self-Care Disability
Self-Care Disability Comparison
Japanese
Norwegians
2.7%
SELF-CARE DISABILITY
0.1/ 100
METRIC RATING
276th/ 347
METRIC RANK
2.3%
SELF-CARE DISABILITY
99.8/ 100
METRIC RATING
45th/ 347
METRIC RANK
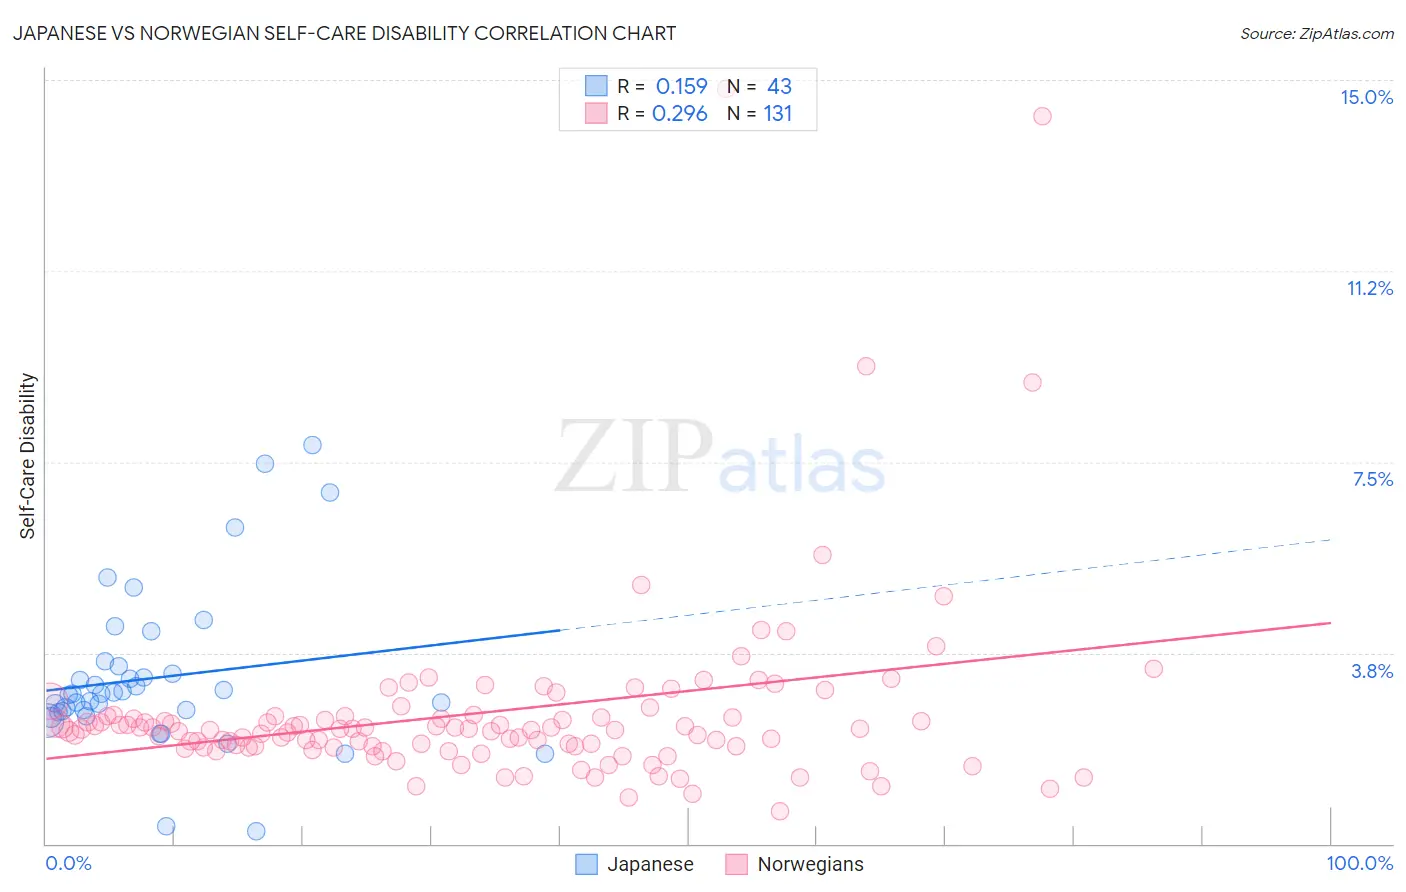
Japanese vs Norwegian Self-Care Disability Correlation Chart
The statistical analysis conducted on geographies consisting of 249,013,660 people shows a poor positive correlation between the proportion of Japanese and percentage of population with self-care disability in the United States with a correlation coefficient (R) of 0.159 and weighted average of 2.7%. Similarly, the statistical analysis conducted on geographies consisting of 531,593,682 people shows a weak positive correlation between the proportion of Norwegians and percentage of population with self-care disability in the United States with a correlation coefficient (R) of 0.296 and weighted average of 2.3%, a difference of 17.4%.
Self-Care Disability Correlation Summary
| Measurement | Japanese | Norwegian |
| Minimum | 0.26% | 0.64% |
| Maximum | 7.8% | 14.8% |
| Range | 7.6% | 14.2% |
| Mean | 3.3% | 2.6% |
| Median | 2.9% | 2.2% |
| Interquartile 25% (IQ1) | 2.6% | 1.9% |
| Interquartile 75% (IQ3) | 3.5% | 2.5% |
| Interquartile Range (IQR) | 0.91% | 0.60% |
| Standard Deviation (Sample) | 1.6% | 1.9% |
| Standard Deviation (Population) | 1.5% | 1.9% |
Similar Demographics by Self-Care Disability
Demographics Similar to Japanese by Self-Care Disability
In terms of self-care disability, the demographic groups most similar to Japanese are Immigrants from Ukraine (2.7%, a difference of 0.060%), Yakama (2.7%, a difference of 0.13%), Immigrants from Trinidad and Tobago (2.7%, a difference of 0.13%), Ottawa (2.7%, a difference of 0.14%), and Mexican (2.7%, a difference of 0.19%).
| Demographics | Rating | Rank | Self-Care Disability |
| U.S. Virgin Islanders | 0.1 /100 | #269 | Tragic 2.7% |
| Immigrants | Micronesia | 0.1 /100 | #270 | Tragic 2.7% |
| Trinidadians and Tobagonians | 0.1 /100 | #271 | Tragic 2.7% |
| Immigrants | Laos | 0.1 /100 | #272 | Tragic 2.7% |
| Mexicans | 0.1 /100 | #273 | Tragic 2.7% |
| Yakama | 0.1 /100 | #274 | Tragic 2.7% |
| Immigrants | Trinidad and Tobago | 0.1 /100 | #275 | Tragic 2.7% |
| Japanese | 0.1 /100 | #276 | Tragic 2.7% |
| Immigrants | Ukraine | 0.1 /100 | #277 | Tragic 2.7% |
| Ottawa | 0.1 /100 | #278 | Tragic 2.7% |
| Iroquois | 0.1 /100 | #279 | Tragic 2.7% |
| Hispanics or Latinos | 0.1 /100 | #280 | Tragic 2.7% |
| Immigrants | Iraq | 0.0 /100 | #281 | Tragic 2.7% |
| Apache | 0.0 /100 | #282 | Tragic 2.7% |
| Delaware | 0.0 /100 | #283 | Tragic 2.7% |
Demographics Similar to Norwegians by Self-Care Disability
In terms of self-care disability, the demographic groups most similar to Norwegians are Immigrants from South Africa (2.3%, a difference of 0.040%), Czech (2.3%, a difference of 0.080%), Immigrants from Pakistan (2.3%, a difference of 0.090%), Immigrants from Uganda (2.3%, a difference of 0.13%), and Immigrants from Sudan (2.3%, a difference of 0.23%).
| Demographics | Rating | Rank | Self-Care Disability |
| Immigrants | Eastern Africa | 99.9 /100 | #38 | Exceptional 2.3% |
| Immigrants | Bulgaria | 99.8 /100 | #39 | Exceptional 2.3% |
| Iranians | 99.8 /100 | #40 | Exceptional 2.3% |
| Immigrants | Sudan | 99.8 /100 | #41 | Exceptional 2.3% |
| Immigrants | Uganda | 99.8 /100 | #42 | Exceptional 2.3% |
| Immigrants | Pakistan | 99.8 /100 | #43 | Exceptional 2.3% |
| Immigrants | South Africa | 99.8 /100 | #44 | Exceptional 2.3% |
| Norwegians | 99.8 /100 | #45 | Exceptional 2.3% |
| Czechs | 99.8 /100 | #46 | Exceptional 2.3% |
| Jordanians | 99.7 /100 | #47 | Exceptional 2.3% |
| Immigrants | Malaysia | 99.7 /100 | #48 | Exceptional 2.3% |
| Latvians | 99.7 /100 | #49 | Exceptional 2.3% |
| Immigrants | Brazil | 99.7 /100 | #50 | Exceptional 2.3% |
| Kenyans | 99.7 /100 | #51 | Exceptional 2.3% |
| Immigrants | Serbia | 99.6 /100 | #52 | Exceptional 2.3% |