Jamaican vs Italian Disability
COMPARE
Jamaican
Italian
Disability
Disability Comparison
Jamaicans
Italians
12.1%
DISABILITY
3.3/ 100
METRIC RATING
226th/ 347
METRIC RANK
12.2%
DISABILITY
2.5/ 100
METRIC RATING
232nd/ 347
METRIC RANK
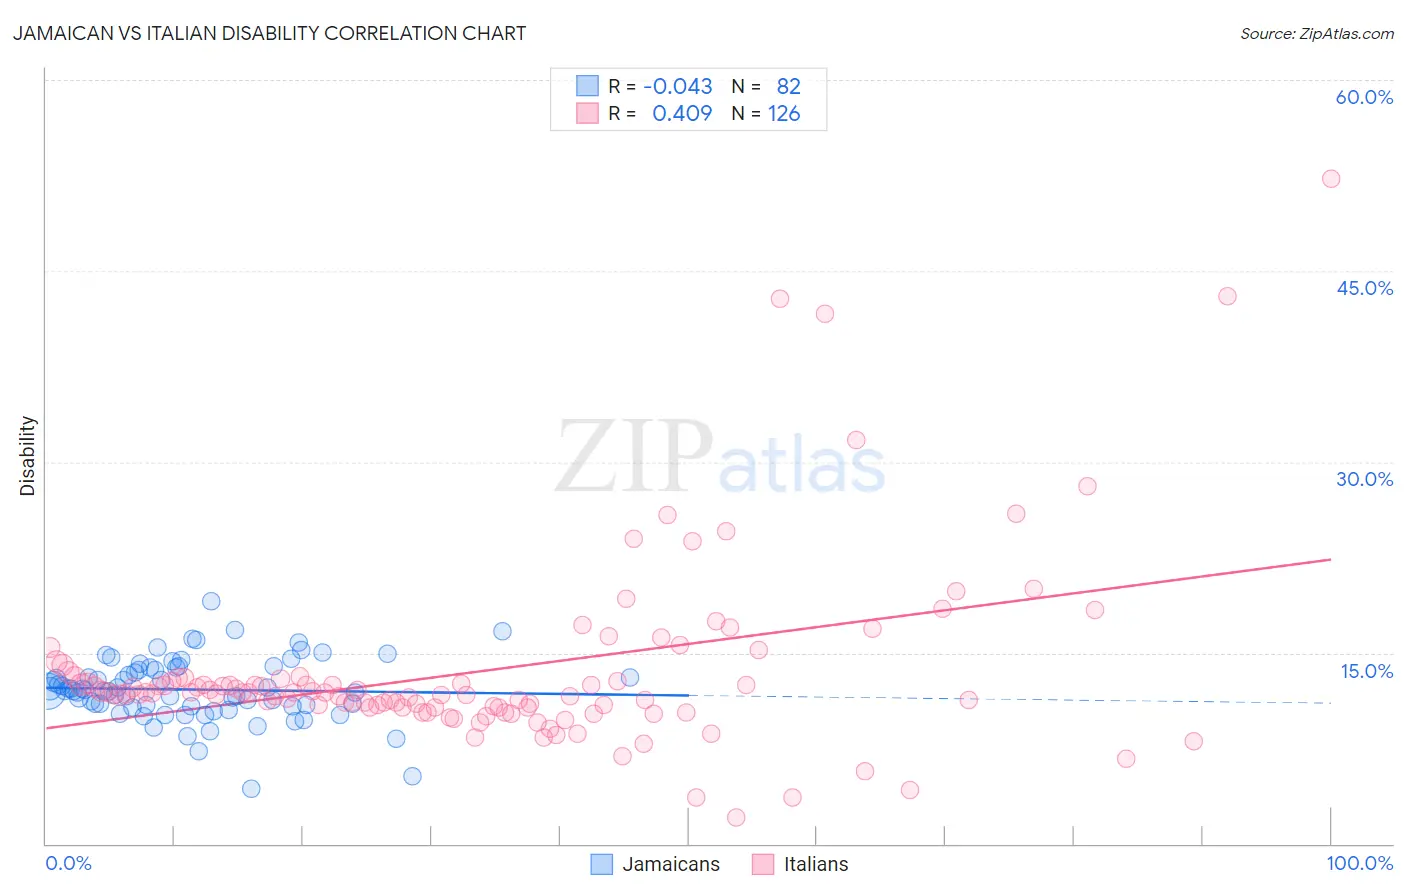
Jamaican vs Italian Disability Correlation Chart
The statistical analysis conducted on geographies consisting of 367,991,297 people shows no correlation between the proportion of Jamaicans and percentage of population with a disability in the United States with a correlation coefficient (R) of -0.043 and weighted average of 12.1%. Similarly, the statistical analysis conducted on geographies consisting of 574,930,842 people shows a moderate positive correlation between the proportion of Italians and percentage of population with a disability in the United States with a correlation coefficient (R) of 0.409 and weighted average of 12.2%, a difference of 0.29%.
Disability Correlation Summary
| Measurement | Jamaican | Italian |
| Minimum | 4.3% | 2.1% |
| Maximum | 19.1% | 52.3% |
| Range | 14.8% | 50.2% |
| Mean | 12.1% | 13.5% |
| Median | 12.0% | 11.8% |
| Interquartile 25% (IQ1) | 10.8% | 10.7% |
| Interquartile 75% (IQ3) | 13.7% | 13.0% |
| Interquartile Range (IQR) | 2.9% | 2.3% |
| Standard Deviation (Sample) | 2.4% | 7.3% |
| Standard Deviation (Population) | 2.4% | 7.2% |
Demographics Similar to Jamaicans and Italians by Disability
In terms of disability, the demographic groups most similar to Jamaicans are Alsatian (12.1%, a difference of 0.010%), Senegalese (12.1%, a difference of 0.050%), Mexican (12.1%, a difference of 0.13%), West Indian (12.2%, a difference of 0.15%), and Inupiat (12.2%, a difference of 0.17%). Similarly, the demographic groups most similar to Italians are Malaysian (12.2%, a difference of 0.010%), Samoan (12.2%, a difference of 0.040%), Bahamian (12.2%, a difference of 0.090%), Inupiat (12.2%, a difference of 0.12%), and Japanese (12.2%, a difference of 0.12%).
| Demographics | Rating | Rank | Disability |
| Croatians | 4.9 /100 | #219 | Tragic 12.1% |
| Immigrants | Bahamas | 4.7 /100 | #220 | Tragic 12.1% |
| Northern Europeans | 4.2 /100 | #221 | Tragic 12.1% |
| Spanish American Indians | 4.1 /100 | #222 | Tragic 12.1% |
| Hispanics or Latinos | 3.9 /100 | #223 | Tragic 12.1% |
| Mexicans | 3.7 /100 | #224 | Tragic 12.1% |
| Senegalese | 3.5 /100 | #225 | Tragic 12.1% |
| Jamaicans | 3.3 /100 | #226 | Tragic 12.1% |
| Alsatians | 3.3 /100 | #227 | Tragic 12.1% |
| West Indians | 2.9 /100 | #228 | Tragic 12.2% |
| Inupiat | 2.8 /100 | #229 | Tragic 12.2% |
| Samoans | 2.6 /100 | #230 | Tragic 12.2% |
| Malaysians | 2.5 /100 | #231 | Tragic 12.2% |
| Italians | 2.5 /100 | #232 | Tragic 12.2% |
| Bahamians | 2.3 /100 | #233 | Tragic 12.2% |
| Japanese | 2.3 /100 | #234 | Tragic 12.2% |
| Yup'ik | 2.2 /100 | #235 | Tragic 12.2% |
| Chinese | 2.0 /100 | #236 | Tragic 12.2% |
| Immigrants | Congo | 1.9 /100 | #237 | Tragic 12.2% |
| Norwegians | 1.9 /100 | #238 | Tragic 12.2% |
| Swedes | 1.8 /100 | #239 | Tragic 12.2% |