Jamaican vs British Disability
COMPARE
Jamaican
British
Disability
Disability Comparison
Jamaicans
British
12.1%
DISABILITY
3.3/ 100
METRIC RATING
226th/ 347
METRIC RANK
12.2%
DISABILITY
1.5/ 100
METRIC RATING
243rd/ 347
METRIC RANK
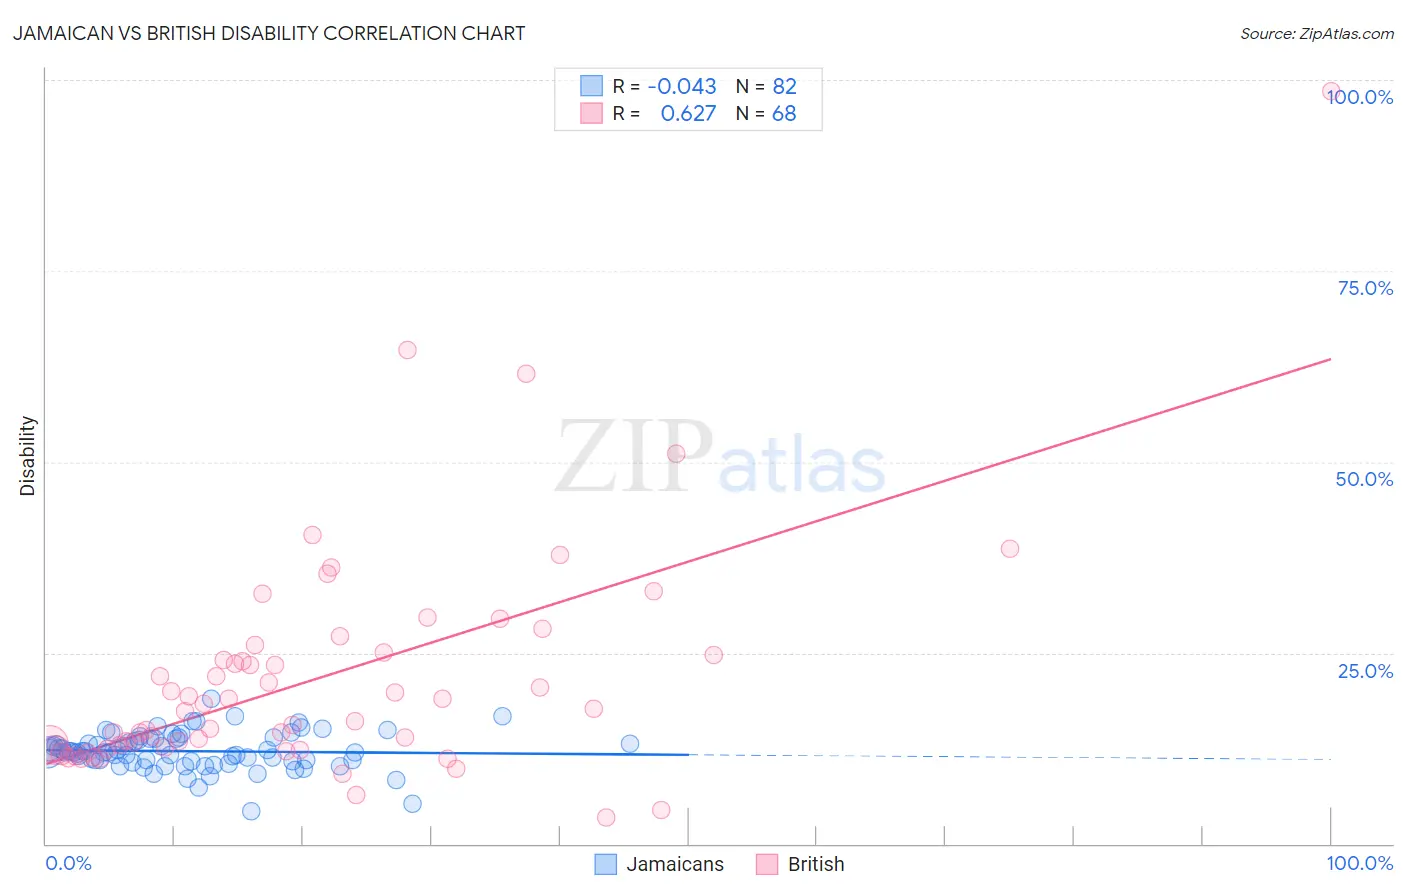
Jamaican vs British Disability Correlation Chart
The statistical analysis conducted on geographies consisting of 367,991,297 people shows no correlation between the proportion of Jamaicans and percentage of population with a disability in the United States with a correlation coefficient (R) of -0.043 and weighted average of 12.1%. Similarly, the statistical analysis conducted on geographies consisting of 531,410,774 people shows a significant positive correlation between the proportion of British and percentage of population with a disability in the United States with a correlation coefficient (R) of 0.627 and weighted average of 12.2%, a difference of 0.84%.
Disability Correlation Summary
| Measurement | Jamaican | British |
| Minimum | 4.3% | 3.5% |
| Maximum | 19.1% | 98.5% |
| Range | 14.8% | 95.0% |
| Mean | 12.1% | 21.7% |
| Median | 12.0% | 17.5% |
| Interquartile 25% (IQ1) | 10.8% | 12.6% |
| Interquartile 75% (IQ3) | 13.7% | 24.8% |
| Interquartile Range (IQR) | 2.9% | 12.3% |
| Standard Deviation (Sample) | 2.4% | 15.1% |
| Standard Deviation (Population) | 2.4% | 15.0% |
Demographics Similar to Jamaicans and British by Disability
In terms of disability, the demographic groups most similar to Jamaicans are Alsatian (12.1%, a difference of 0.010%), Senegalese (12.1%, a difference of 0.050%), Mexican (12.1%, a difference of 0.13%), West Indian (12.2%, a difference of 0.15%), and Inupiat (12.2%, a difference of 0.17%). Similarly, the demographic groups most similar to British are Basque (12.2%, a difference of 0.0%), Polish (12.2%, a difference of 0.090%), Hungarian (12.2%, a difference of 0.11%), Yugoslavian (12.2%, a difference of 0.11%), and Swedish (12.2%, a difference of 0.16%).
| Demographics | Rating | Rank | Disability |
| Mexicans | 3.7 /100 | #224 | Tragic 12.1% |
| Senegalese | 3.5 /100 | #225 | Tragic 12.1% |
| Jamaicans | 3.3 /100 | #226 | Tragic 12.1% |
| Alsatians | 3.3 /100 | #227 | Tragic 12.1% |
| West Indians | 2.9 /100 | #228 | Tragic 12.2% |
| Inupiat | 2.8 /100 | #229 | Tragic 12.2% |
| Samoans | 2.6 /100 | #230 | Tragic 12.2% |
| Malaysians | 2.5 /100 | #231 | Tragic 12.2% |
| Italians | 2.5 /100 | #232 | Tragic 12.2% |
| Bahamians | 2.3 /100 | #233 | Tragic 12.2% |
| Japanese | 2.3 /100 | #234 | Tragic 12.2% |
| Yup'ik | 2.2 /100 | #235 | Tragic 12.2% |
| Chinese | 2.0 /100 | #236 | Tragic 12.2% |
| Immigrants | Congo | 1.9 /100 | #237 | Tragic 12.2% |
| Norwegians | 1.9 /100 | #238 | Tragic 12.2% |
| Swedes | 1.8 /100 | #239 | Tragic 12.2% |
| Hungarians | 1.7 /100 | #240 | Tragic 12.2% |
| Yugoslavians | 1.7 /100 | #241 | Tragic 12.2% |
| Poles | 1.7 /100 | #242 | Tragic 12.2% |
| British | 1.5 /100 | #243 | Tragic 12.2% |
| Basques | 1.5 /100 | #244 | Tragic 12.2% |