African vs Italian Disability
COMPARE
African
Italian
Disability
Disability Comparison
Africans
Italians
13.0%
DISABILITY
0.0/ 100
METRIC RATING
287th/ 347
METRIC RANK
12.2%
DISABILITY
2.5/ 100
METRIC RATING
232nd/ 347
METRIC RANK
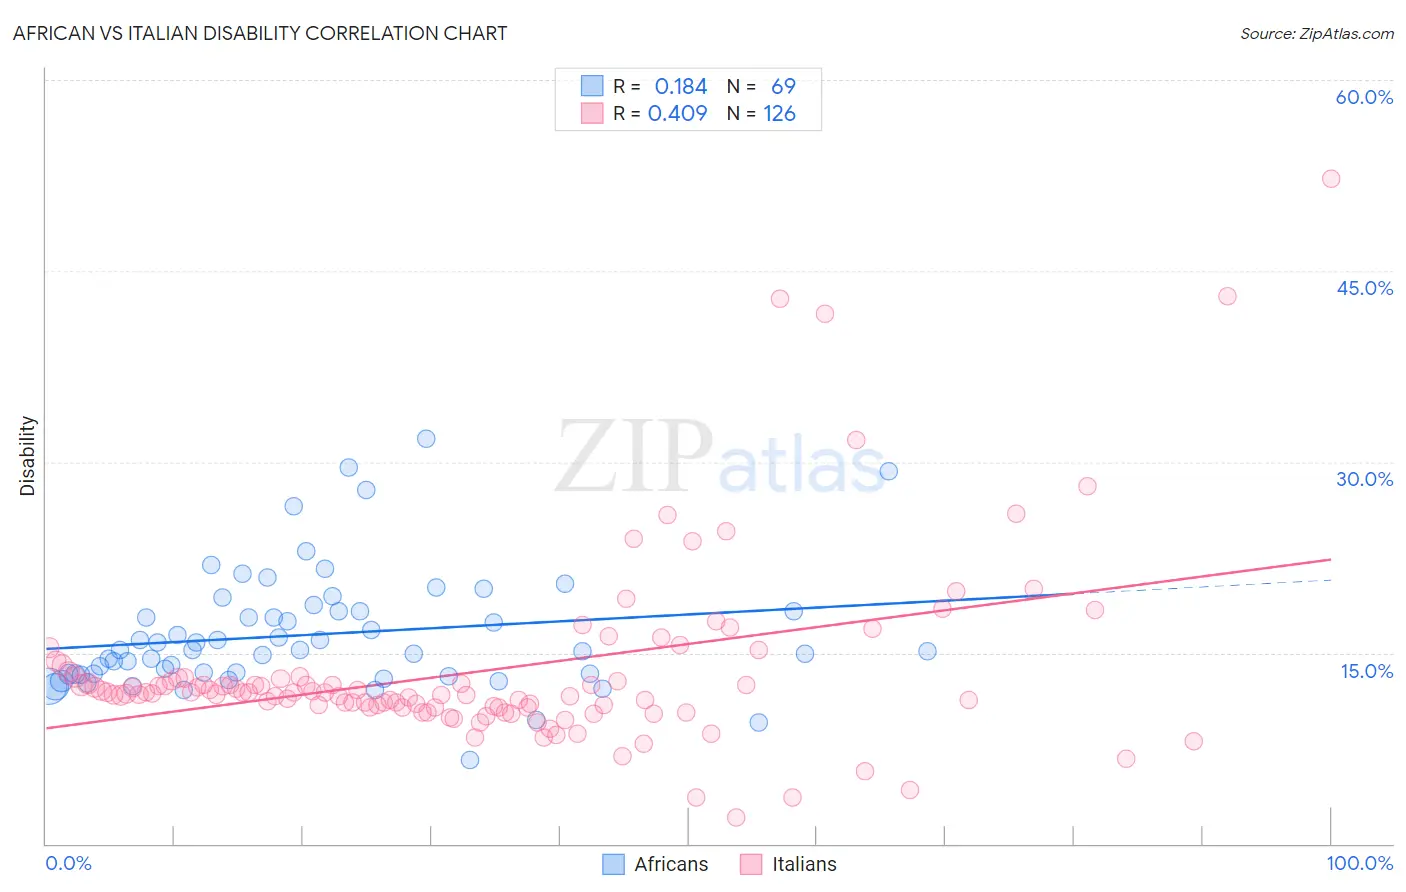
African vs Italian Disability Correlation Chart
The statistical analysis conducted on geographies consisting of 469,989,744 people shows a poor positive correlation between the proportion of Africans and percentage of population with a disability in the United States with a correlation coefficient (R) of 0.184 and weighted average of 13.0%. Similarly, the statistical analysis conducted on geographies consisting of 574,930,842 people shows a moderate positive correlation between the proportion of Italians and percentage of population with a disability in the United States with a correlation coefficient (R) of 0.409 and weighted average of 12.2%, a difference of 6.9%.
Disability Correlation Summary
| Measurement | African | Italian |
| Minimum | 6.6% | 2.1% |
| Maximum | 31.8% | 52.3% |
| Range | 25.2% | 50.2% |
| Mean | 16.4% | 13.5% |
| Median | 15.2% | 11.8% |
| Interquartile 25% (IQ1) | 13.3% | 10.7% |
| Interquartile 75% (IQ3) | 18.3% | 13.0% |
| Interquartile Range (IQR) | 5.0% | 2.3% |
| Standard Deviation (Sample) | 4.7% | 7.3% |
| Standard Deviation (Population) | 4.7% | 7.2% |
Similar Demographics by Disability
Demographics Similar to Africans by Disability
In terms of disability, the demographic groups most similar to Africans are White/Caucasian (13.0%, a difference of 0.020%), Slovak (13.0%, a difference of 0.020%), Cheyenne (13.0%, a difference of 0.080%), Yaqui (13.1%, a difference of 0.31%), and English (13.0%, a difference of 0.41%).
| Demographics | Rating | Rank | Disability |
| Spanish | 0.0 /100 | #280 | Tragic 12.8% |
| Immigrants | Portugal | 0.0 /100 | #281 | Tragic 12.9% |
| Scottish | 0.0 /100 | #282 | Tragic 12.9% |
| Irish | 0.0 /100 | #283 | Tragic 12.9% |
| Welsh | 0.0 /100 | #284 | Tragic 12.9% |
| Crow | 0.0 /100 | #285 | Tragic 12.9% |
| English | 0.0 /100 | #286 | Tragic 13.0% |
| Africans | 0.0 /100 | #287 | Tragic 13.0% |
| Whites/Caucasians | 0.0 /100 | #288 | Tragic 13.0% |
| Slovaks | 0.0 /100 | #289 | Tragic 13.0% |
| Cheyenne | 0.0 /100 | #290 | Tragic 13.0% |
| Yaqui | 0.0 /100 | #291 | Tragic 13.1% |
| Aleuts | 0.0 /100 | #292 | Tragic 13.1% |
| Marshallese | 0.0 /100 | #293 | Tragic 13.1% |
| Celtics | 0.0 /100 | #294 | Tragic 13.1% |
Demographics Similar to Italians by Disability
In terms of disability, the demographic groups most similar to Italians are Malaysian (12.2%, a difference of 0.010%), Samoan (12.2%, a difference of 0.040%), Bahamian (12.2%, a difference of 0.090%), Inupiat (12.2%, a difference of 0.12%), and Japanese (12.2%, a difference of 0.12%).
| Demographics | Rating | Rank | Disability |
| Senegalese | 3.5 /100 | #225 | Tragic 12.1% |
| Jamaicans | 3.3 /100 | #226 | Tragic 12.1% |
| Alsatians | 3.3 /100 | #227 | Tragic 12.1% |
| West Indians | 2.9 /100 | #228 | Tragic 12.2% |
| Inupiat | 2.8 /100 | #229 | Tragic 12.2% |
| Samoans | 2.6 /100 | #230 | Tragic 12.2% |
| Malaysians | 2.5 /100 | #231 | Tragic 12.2% |
| Italians | 2.5 /100 | #232 | Tragic 12.2% |
| Bahamians | 2.3 /100 | #233 | Tragic 12.2% |
| Japanese | 2.3 /100 | #234 | Tragic 12.2% |
| Yup'ik | 2.2 /100 | #235 | Tragic 12.2% |
| Chinese | 2.0 /100 | #236 | Tragic 12.2% |
| Immigrants | Congo | 1.9 /100 | #237 | Tragic 12.2% |
| Norwegians | 1.9 /100 | #238 | Tragic 12.2% |
| Swedes | 1.8 /100 | #239 | Tragic 12.2% |