Navajo vs Italian Disability
COMPARE
Navajo
Italian
Disability
Disability Comparison
Navajo
Italians
14.3%
DISABILITY
0.0/ 100
METRIC RATING
330th/ 347
METRIC RANK
12.2%
DISABILITY
2.5/ 100
METRIC RATING
232nd/ 347
METRIC RANK
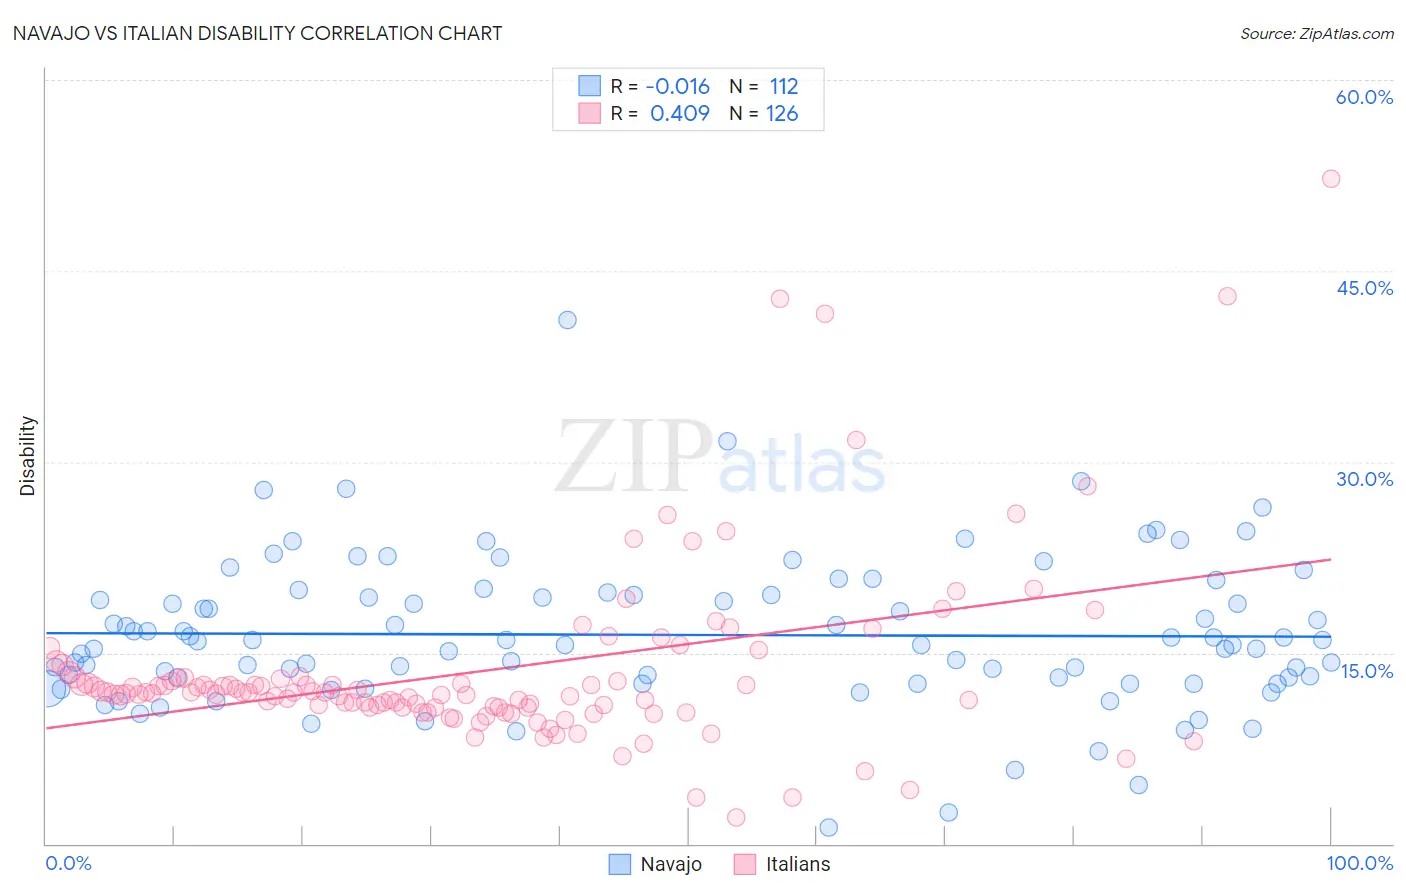
Navajo vs Italian Disability Correlation Chart
The statistical analysis conducted on geographies consisting of 224,790,018 people shows no correlation between the proportion of Navajo and percentage of population with a disability in the United States with a correlation coefficient (R) of -0.016 and weighted average of 14.3%. Similarly, the statistical analysis conducted on geographies consisting of 574,930,842 people shows a moderate positive correlation between the proportion of Italians and percentage of population with a disability in the United States with a correlation coefficient (R) of 0.409 and weighted average of 12.2%, a difference of 17.2%.
Disability Correlation Summary
| Measurement | Navajo | Italian |
| Minimum | 1.3% | 2.1% |
| Maximum | 41.2% | 52.3% |
| Range | 39.9% | 50.2% |
| Mean | 16.4% | 13.5% |
| Median | 15.8% | 11.8% |
| Interquartile 25% (IQ1) | 12.8% | 10.7% |
| Interquartile 75% (IQ3) | 19.5% | 13.0% |
| Interquartile Range (IQR) | 6.7% | 2.3% |
| Standard Deviation (Sample) | 5.9% | 7.3% |
| Standard Deviation (Population) | 5.8% | 7.2% |
Similar Demographics by Disability
Demographics Similar to Navajo by Disability
In terms of disability, the demographic groups most similar to Navajo are Potawatomi (14.2%, a difference of 0.59%), Ottawa (14.2%, a difference of 0.71%), Immigrants from the Azores (14.2%, a difference of 0.71%), Osage (14.2%, a difference of 0.73%), and Native/Alaskan (14.2%, a difference of 0.76%).
| Demographics | Rating | Rank | Disability |
| Comanche | 0.0 /100 | #323 | Tragic 14.1% |
| Chippewa | 0.0 /100 | #324 | Tragic 14.1% |
| Natives/Alaskans | 0.0 /100 | #325 | Tragic 14.2% |
| Osage | 0.0 /100 | #326 | Tragic 14.2% |
| Ottawa | 0.0 /100 | #327 | Tragic 14.2% |
| Immigrants | Azores | 0.0 /100 | #328 | Tragic 14.2% |
| Potawatomi | 0.0 /100 | #329 | Tragic 14.2% |
| Navajo | 0.0 /100 | #330 | Tragic 14.3% |
| Alaskan Athabascans | 0.0 /100 | #331 | Tragic 14.4% |
| Pueblo | 0.0 /100 | #332 | Tragic 14.4% |
| Cajuns | 0.0 /100 | #333 | Tragic 14.6% |
| Yuman | 0.0 /100 | #334 | Tragic 14.6% |
| Tohono O'odham | 0.0 /100 | #335 | Tragic 14.8% |
| Cherokee | 0.0 /100 | #336 | Tragic 14.8% |
| Seminole | 0.0 /100 | #337 | Tragic 14.9% |
Demographics Similar to Italians by Disability
In terms of disability, the demographic groups most similar to Italians are Malaysian (12.2%, a difference of 0.010%), Samoan (12.2%, a difference of 0.040%), Bahamian (12.2%, a difference of 0.090%), Inupiat (12.2%, a difference of 0.12%), and Japanese (12.2%, a difference of 0.12%).
| Demographics | Rating | Rank | Disability |
| Senegalese | 3.5 /100 | #225 | Tragic 12.1% |
| Jamaicans | 3.3 /100 | #226 | Tragic 12.1% |
| Alsatians | 3.3 /100 | #227 | Tragic 12.1% |
| West Indians | 2.9 /100 | #228 | Tragic 12.2% |
| Inupiat | 2.8 /100 | #229 | Tragic 12.2% |
| Samoans | 2.6 /100 | #230 | Tragic 12.2% |
| Malaysians | 2.5 /100 | #231 | Tragic 12.2% |
| Italians | 2.5 /100 | #232 | Tragic 12.2% |
| Bahamians | 2.3 /100 | #233 | Tragic 12.2% |
| Japanese | 2.3 /100 | #234 | Tragic 12.2% |
| Yup'ik | 2.2 /100 | #235 | Tragic 12.2% |
| Chinese | 2.0 /100 | #236 | Tragic 12.2% |
| Immigrants | Congo | 1.9 /100 | #237 | Tragic 12.2% |
| Norwegians | 1.9 /100 | #238 | Tragic 12.2% |
| Swedes | 1.8 /100 | #239 | Tragic 12.2% |