Jamaican vs Iroquois Disability
COMPARE
Jamaican
Iroquois
Disability
Disability Comparison
Jamaicans
Iroquois
12.1%
DISABILITY
3.3/ 100
METRIC RATING
226th/ 347
METRIC RANK
13.8%
DISABILITY
0.0/ 100
METRIC RATING
319th/ 347
METRIC RANK
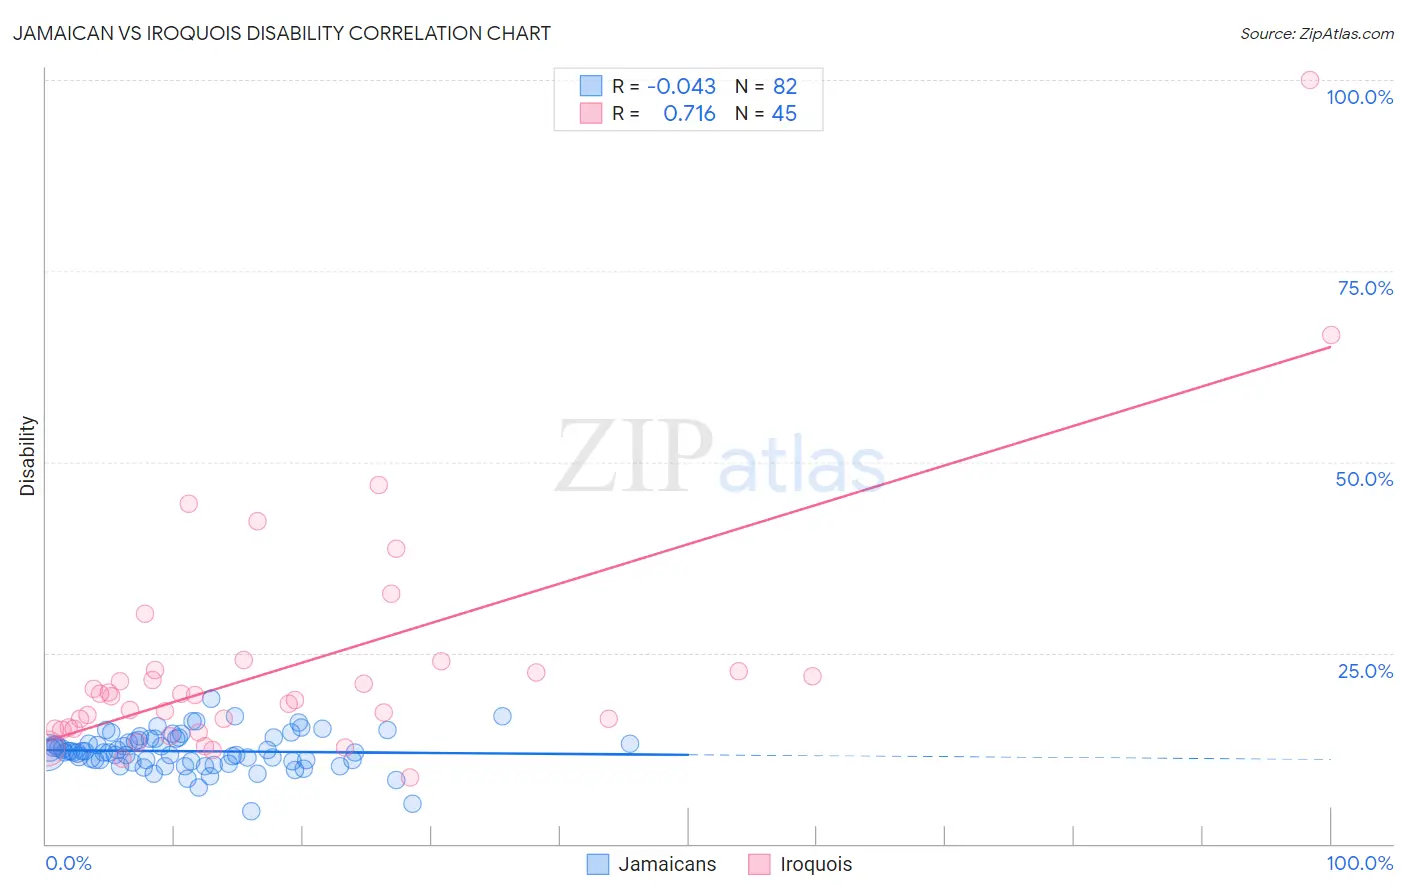
Jamaican vs Iroquois Disability Correlation Chart
The statistical analysis conducted on geographies consisting of 367,991,297 people shows no correlation between the proportion of Jamaicans and percentage of population with a disability in the United States with a correlation coefficient (R) of -0.043 and weighted average of 12.1%. Similarly, the statistical analysis conducted on geographies consisting of 207,277,318 people shows a strong positive correlation between the proportion of Iroquois and percentage of population with a disability in the United States with a correlation coefficient (R) of 0.716 and weighted average of 13.8%, a difference of 13.8%.
Disability Correlation Summary
| Measurement | Jamaican | Iroquois |
| Minimum | 4.3% | 8.7% |
| Maximum | 19.1% | 100.0% |
| Range | 14.8% | 91.3% |
| Mean | 12.1% | 23.3% |
| Median | 12.0% | 19.3% |
| Interquartile 25% (IQ1) | 10.8% | 15.0% |
| Interquartile 75% (IQ3) | 13.7% | 22.7% |
| Interquartile Range (IQR) | 2.9% | 7.7% |
| Standard Deviation (Sample) | 2.4% | 16.0% |
| Standard Deviation (Population) | 2.4% | 15.8% |
Similar Demographics by Disability
Demographics Similar to Jamaicans by Disability
In terms of disability, the demographic groups most similar to Jamaicans are Alsatian (12.1%, a difference of 0.010%), Senegalese (12.1%, a difference of 0.050%), Mexican (12.1%, a difference of 0.13%), West Indian (12.2%, a difference of 0.15%), and Inupiat (12.2%, a difference of 0.17%).
| Demographics | Rating | Rank | Disability |
| Croatians | 4.9 /100 | #219 | Tragic 12.1% |
| Immigrants | Bahamas | 4.7 /100 | #220 | Tragic 12.1% |
| Northern Europeans | 4.2 /100 | #221 | Tragic 12.1% |
| Spanish American Indians | 4.1 /100 | #222 | Tragic 12.1% |
| Hispanics or Latinos | 3.9 /100 | #223 | Tragic 12.1% |
| Mexicans | 3.7 /100 | #224 | Tragic 12.1% |
| Senegalese | 3.5 /100 | #225 | Tragic 12.1% |
| Jamaicans | 3.3 /100 | #226 | Tragic 12.1% |
| Alsatians | 3.3 /100 | #227 | Tragic 12.1% |
| West Indians | 2.9 /100 | #228 | Tragic 12.2% |
| Inupiat | 2.8 /100 | #229 | Tragic 12.2% |
| Samoans | 2.6 /100 | #230 | Tragic 12.2% |
| Malaysians | 2.5 /100 | #231 | Tragic 12.2% |
| Italians | 2.5 /100 | #232 | Tragic 12.2% |
| Bahamians | 2.3 /100 | #233 | Tragic 12.2% |
Demographics Similar to Iroquois by Disability
In terms of disability, the demographic groups most similar to Iroquois are Menominee (13.8%, a difference of 0.21%), Apache (13.9%, a difference of 0.29%), Paiute (13.9%, a difference of 0.42%), Pima (13.7%, a difference of 0.79%), and Immigrants from Cabo Verde (13.7%, a difference of 0.79%).
| Demographics | Rating | Rank | Disability |
| Spanish Americans | 0.0 /100 | #312 | Tragic 13.6% |
| Cree | 0.0 /100 | #313 | Tragic 13.7% |
| Blacks/African Americans | 0.0 /100 | #314 | Tragic 13.7% |
| Puget Sound Salish | 0.0 /100 | #315 | Tragic 13.7% |
| Pima | 0.0 /100 | #316 | Tragic 13.7% |
| Immigrants | Cabo Verde | 0.0 /100 | #317 | Tragic 13.7% |
| Menominee | 0.0 /100 | #318 | Tragic 13.8% |
| Iroquois | 0.0 /100 | #319 | Tragic 13.8% |
| Apache | 0.0 /100 | #320 | Tragic 13.9% |
| Paiute | 0.0 /100 | #321 | Tragic 13.9% |
| Americans | 0.0 /100 | #322 | Tragic 13.9% |
| Comanche | 0.0 /100 | #323 | Tragic 14.1% |
| Chippewa | 0.0 /100 | #324 | Tragic 14.1% |
| Natives/Alaskans | 0.0 /100 | #325 | Tragic 14.2% |
| Osage | 0.0 /100 | #326 | Tragic 14.2% |