Central American Indian vs Italian Disability
COMPARE
Central American Indian
Italian
Disability
Disability Comparison
Central American Indians
Italians
13.2%
DISABILITY
0.0/ 100
METRIC RATING
296th/ 347
METRIC RANK
12.2%
DISABILITY
2.5/ 100
METRIC RATING
232nd/ 347
METRIC RANK
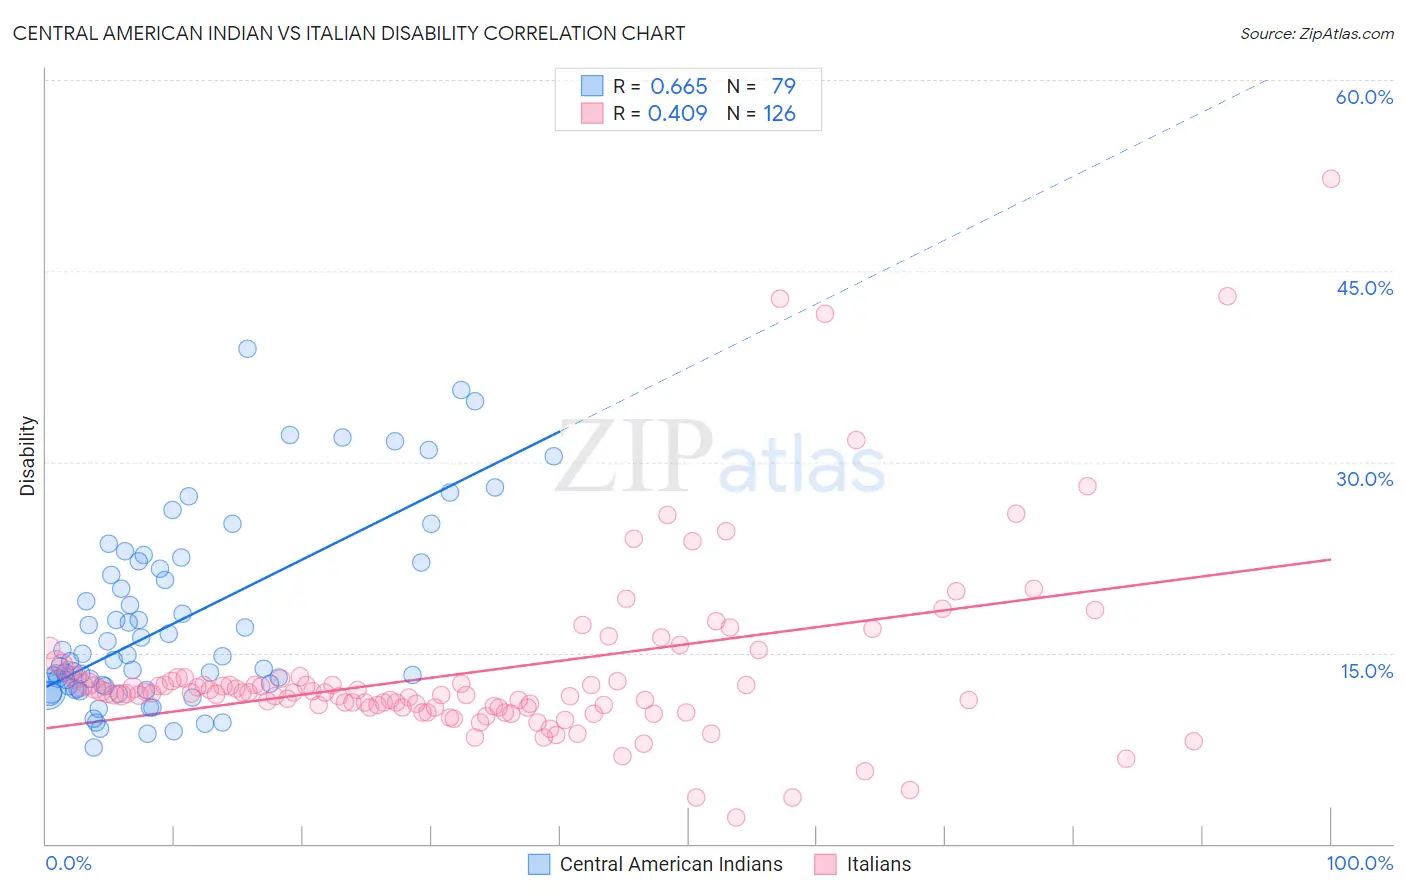
Central American Indian vs Italian Disability Correlation Chart
The statistical analysis conducted on geographies consisting of 326,115,118 people shows a significant positive correlation between the proportion of Central American Indians and percentage of population with a disability in the United States with a correlation coefficient (R) of 0.665 and weighted average of 13.2%. Similarly, the statistical analysis conducted on geographies consisting of 574,930,842 people shows a moderate positive correlation between the proportion of Italians and percentage of population with a disability in the United States with a correlation coefficient (R) of 0.409 and weighted average of 12.2%, a difference of 8.1%.
Disability Correlation Summary
| Measurement | Central American Indian | Italian |
| Minimum | 7.6% | 2.1% |
| Maximum | 38.8% | 52.3% |
| Range | 31.2% | 50.2% |
| Mean | 17.4% | 13.5% |
| Median | 14.4% | 11.8% |
| Interquartile 25% (IQ1) | 12.2% | 10.7% |
| Interquartile 75% (IQ3) | 22.1% | 13.0% |
| Interquartile Range (IQR) | 9.9% | 2.3% |
| Standard Deviation (Sample) | 7.3% | 7.3% |
| Standard Deviation (Population) | 7.3% | 7.2% |
Similar Demographics by Disability
Demographics Similar to Central American Indians by Disability
In terms of disability, the demographic groups most similar to Central American Indians are Nonimmigrants (13.2%, a difference of 0.040%), Hopi (13.2%, a difference of 0.060%), Alaska Native (13.2%, a difference of 0.070%), French (13.2%, a difference of 0.080%), and Pennsylvania German (13.2%, a difference of 0.13%).
| Demographics | Rating | Rank | Disability |
| Slovaks | 0.0 /100 | #289 | Tragic 13.0% |
| Cheyenne | 0.0 /100 | #290 | Tragic 13.0% |
| Yaqui | 0.0 /100 | #291 | Tragic 13.1% |
| Aleuts | 0.0 /100 | #292 | Tragic 13.1% |
| Marshallese | 0.0 /100 | #293 | Tragic 13.1% |
| Celtics | 0.0 /100 | #294 | Tragic 13.1% |
| Immigrants | Nonimmigrants | 0.0 /100 | #295 | Tragic 13.2% |
| Central American Indians | 0.0 /100 | #296 | Tragic 13.2% |
| Hopi | 0.0 /100 | #297 | Tragic 13.2% |
| Alaska Natives | 0.0 /100 | #298 | Tragic 13.2% |
| French | 0.0 /100 | #299 | Tragic 13.2% |
| Pennsylvania Germans | 0.0 /100 | #300 | Tragic 13.2% |
| Immigrants | Micronesia | 0.0 /100 | #301 | Tragic 13.2% |
| Arapaho | 0.0 /100 | #302 | Tragic 13.2% |
| Scotch-Irish | 0.0 /100 | #303 | Tragic 13.3% |
Demographics Similar to Italians by Disability
In terms of disability, the demographic groups most similar to Italians are Malaysian (12.2%, a difference of 0.010%), Samoan (12.2%, a difference of 0.040%), Bahamian (12.2%, a difference of 0.090%), Inupiat (12.2%, a difference of 0.12%), and Japanese (12.2%, a difference of 0.12%).
| Demographics | Rating | Rank | Disability |
| Senegalese | 3.5 /100 | #225 | Tragic 12.1% |
| Jamaicans | 3.3 /100 | #226 | Tragic 12.1% |
| Alsatians | 3.3 /100 | #227 | Tragic 12.1% |
| West Indians | 2.9 /100 | #228 | Tragic 12.2% |
| Inupiat | 2.8 /100 | #229 | Tragic 12.2% |
| Samoans | 2.6 /100 | #230 | Tragic 12.2% |
| Malaysians | 2.5 /100 | #231 | Tragic 12.2% |
| Italians | 2.5 /100 | #232 | Tragic 12.2% |
| Bahamians | 2.3 /100 | #233 | Tragic 12.2% |
| Japanese | 2.3 /100 | #234 | Tragic 12.2% |
| Yup'ik | 2.2 /100 | #235 | Tragic 12.2% |
| Chinese | 2.0 /100 | #236 | Tragic 12.2% |
| Immigrants | Congo | 1.9 /100 | #237 | Tragic 12.2% |
| Norwegians | 1.9 /100 | #238 | Tragic 12.2% |
| Swedes | 1.8 /100 | #239 | Tragic 12.2% |