Jamaican vs Italian Median Female Earnings
COMPARE
Jamaican
Italian
Median Female Earnings
Median Female Earnings Comparison
Jamaicans
Italians
$38,670
MEDIAN FEMALE EARNINGS
10.5/ 100
METRIC RATING
213th/ 347
METRIC RANK
$41,505
MEDIAN FEMALE EARNINGS
97.7/ 100
METRIC RATING
105th/ 347
METRIC RANK
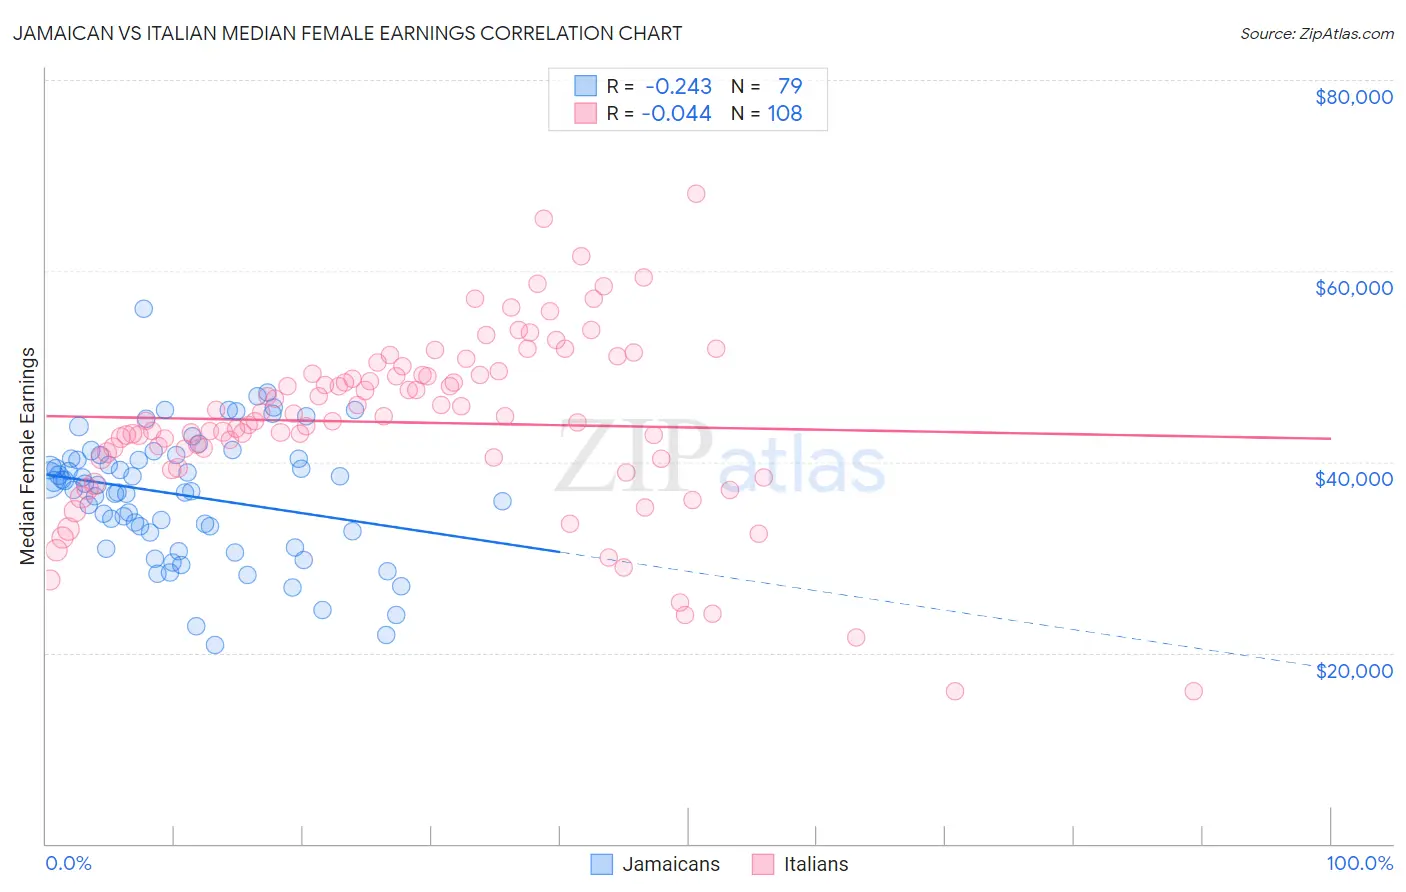
Jamaican vs Italian Median Female Earnings Correlation Chart
The statistical analysis conducted on geographies consisting of 367,929,945 people shows a weak negative correlation between the proportion of Jamaicans and median female earnings in the United States with a correlation coefficient (R) of -0.243 and weighted average of $38,670. Similarly, the statistical analysis conducted on geographies consisting of 573,135,086 people shows no correlation between the proportion of Italians and median female earnings in the United States with a correlation coefficient (R) of -0.044 and weighted average of $41,505, a difference of 7.3%.
Median Female Earnings Correlation Summary
| Measurement | Jamaican | Italian |
| Minimum | $20,833 | $15,938 |
| Maximum | $56,012 | $68,125 |
| Range | $35,179 | $52,187 |
| Mean | $36,507 | $44,140 |
| Median | $37,552 | $44,292 |
| Interquartile 25% (IQ1) | $32,539 | $40,427 |
| Interquartile 75% (IQ3) | $40,387 | $49,180 |
| Interquartile Range (IQR) | $7,848 | $8,753 |
| Standard Deviation (Sample) | $6,597 | $9,271 |
| Standard Deviation (Population) | $6,555 | $9,228 |
Similar Demographics by Median Female Earnings
Demographics Similar to Jamaicans by Median Female Earnings
In terms of median female earnings, the demographic groups most similar to Jamaicans are Iraqi ($38,666, a difference of 0.010%), Spaniard ($38,656, a difference of 0.030%), Immigrants from Ecuador ($38,644, a difference of 0.070%), Guamanian/Chamorro ($38,717, a difference of 0.12%), and Immigrants from Jamaica ($38,625, a difference of 0.12%).
| Demographics | Rating | Rank | Median Female Earnings |
| Immigrants | Bosnia and Herzegovina | 15.6 /100 | #206 | Poor $38,886 |
| Immigrants | Cambodia | 14.2 /100 | #207 | Poor $38,833 |
| Immigrants | Thailand | 13.6 /100 | #208 | Poor $38,810 |
| Norwegians | 13.4 /100 | #209 | Poor $38,802 |
| Czechoslovakians | 12.0 /100 | #210 | Poor $38,738 |
| Aleuts | 11.6 /100 | #211 | Poor $38,719 |
| Guamanians/Chamorros | 11.5 /100 | #212 | Poor $38,717 |
| Jamaicans | 10.5 /100 | #213 | Poor $38,670 |
| Iraqis | 10.5 /100 | #214 | Poor $38,666 |
| Spaniards | 10.3 /100 | #215 | Poor $38,656 |
| Immigrants | Ecuador | 10.1 /100 | #216 | Poor $38,644 |
| Immigrants | Jamaica | 9.7 /100 | #217 | Tragic $38,625 |
| Cape Verdeans | 9.5 /100 | #218 | Tragic $38,614 |
| Nepalese | 9.3 /100 | #219 | Tragic $38,603 |
| Yugoslavians | 8.8 /100 | #220 | Tragic $38,573 |
Demographics Similar to Italians by Median Female Earnings
In terms of median female earnings, the demographic groups most similar to Italians are Immigrants from Zimbabwe ($41,527, a difference of 0.050%), Immigrants from Eritrea ($41,485, a difference of 0.050%), Palestinian ($41,484, a difference of 0.050%), Jordanian ($41,464, a difference of 0.10%), and Chinese ($41,461, a difference of 0.10%).
| Demographics | Rating | Rank | Median Female Earnings |
| Immigrants | Scotland | 98.7 /100 | #98 | Exceptional $41,771 |
| Immigrants | Barbados | 98.4 /100 | #99 | Exceptional $41,685 |
| Romanians | 98.3 /100 | #100 | Exceptional $41,663 |
| Immigrants | Fiji | 98.3 /100 | #101 | Exceptional $41,656 |
| Immigrants | Poland | 98.2 /100 | #102 | Exceptional $41,630 |
| Immigrants | Argentina | 97.9 /100 | #103 | Exceptional $41,554 |
| Immigrants | Zimbabwe | 97.8 /100 | #104 | Exceptional $41,527 |
| Italians | 97.7 /100 | #105 | Exceptional $41,505 |
| Immigrants | Eritrea | 97.6 /100 | #106 | Exceptional $41,485 |
| Palestinians | 97.6 /100 | #107 | Exceptional $41,484 |
| Jordanians | 97.5 /100 | #108 | Exceptional $41,464 |
| Chinese | 97.5 /100 | #109 | Exceptional $41,461 |
| Immigrants | Western Asia | 97.0 /100 | #110 | Exceptional $41,375 |
| Immigrants | Canada | 97.0 /100 | #111 | Exceptional $41,373 |
| Immigrants | North America | 96.7 /100 | #112 | Exceptional $41,319 |