Jamaican vs Italian Divorced or Separated
COMPARE
Jamaican
Italian
Divorced or Separated
Divorced or Separated Comparison
Jamaicans
Italians
12.9%
DIVORCED OR SEPARATED
0.0/ 100
METRIC RATING
293rd/ 347
METRIC RANK
11.9%
DIVORCED OR SEPARATED
77.8/ 100
METRIC RATING
148th/ 347
METRIC RANK
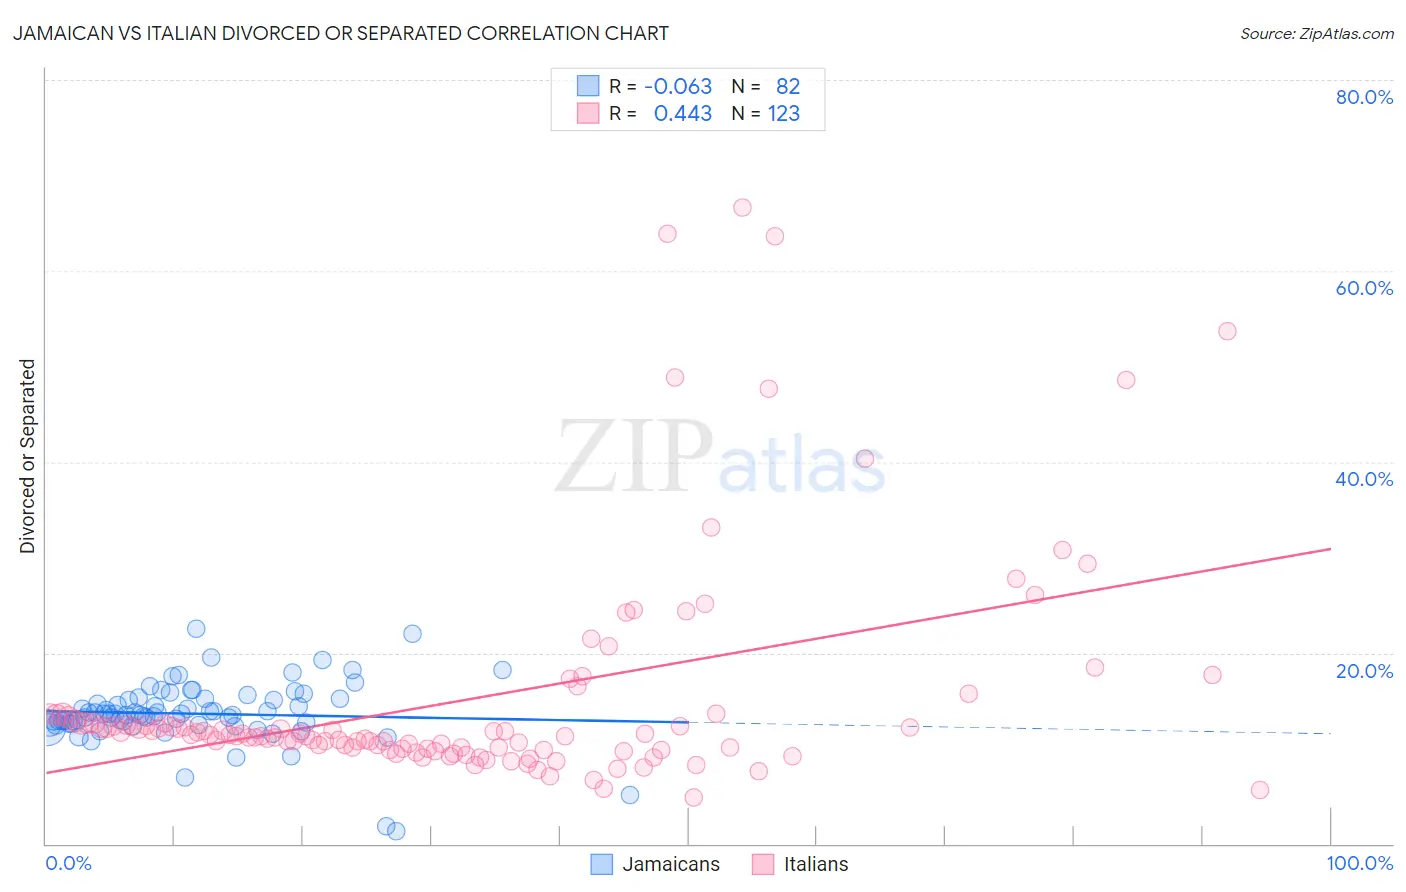
Jamaican vs Italian Divorced or Separated Correlation Chart
The statistical analysis conducted on geographies consisting of 367,802,354 people shows a slight negative correlation between the proportion of Jamaicans and percentage of population currently divorced or separated in the United States with a correlation coefficient (R) of -0.063 and weighted average of 12.9%. Similarly, the statistical analysis conducted on geographies consisting of 574,595,053 people shows a moderate positive correlation between the proportion of Italians and percentage of population currently divorced or separated in the United States with a correlation coefficient (R) of 0.443 and weighted average of 11.9%, a difference of 8.4%.
Divorced or Separated Correlation Summary
| Measurement | Jamaican | Italian |
| Minimum | 1.3% | 4.8% |
| Maximum | 22.5% | 66.7% |
| Range | 21.2% | 61.9% |
| Mean | 13.6% | 15.1% |
| Median | 13.5% | 11.4% |
| Interquartile 25% (IQ1) | 12.6% | 10.0% |
| Interquartile 75% (IQ3) | 15.2% | 12.8% |
| Interquartile Range (IQR) | 2.6% | 2.9% |
| Standard Deviation (Sample) | 3.3% | 11.7% |
| Standard Deviation (Population) | 3.3% | 11.6% |
Similar Demographics by Divorced or Separated
Demographics Similar to Jamaicans by Divorced or Separated
In terms of divorced or separated, the demographic groups most similar to Jamaicans are Apache (12.9%, a difference of 0.030%), Celtic (13.0%, a difference of 0.16%), Scotch-Irish (12.9%, a difference of 0.21%), Immigrants from Honduras (12.9%, a difference of 0.27%), and Pima (12.9%, a difference of 0.38%).
| Demographics | Rating | Rank | Divorced or Separated |
| Spanish | 0.1 /100 | #286 | Tragic 12.8% |
| Hondurans | 0.1 /100 | #287 | Tragic 12.8% |
| French Canadians | 0.1 /100 | #288 | Tragic 12.8% |
| Iroquois | 0.0 /100 | #289 | Tragic 12.9% |
| Pima | 0.0 /100 | #290 | Tragic 12.9% |
| Immigrants | Honduras | 0.0 /100 | #291 | Tragic 12.9% |
| Scotch-Irish | 0.0 /100 | #292 | Tragic 12.9% |
| Jamaicans | 0.0 /100 | #293 | Tragic 12.9% |
| Apache | 0.0 /100 | #294 | Tragic 12.9% |
| Celtics | 0.0 /100 | #295 | Tragic 13.0% |
| Nicaraguans | 0.0 /100 | #296 | Tragic 13.0% |
| Natives/Alaskans | 0.0 /100 | #297 | Tragic 13.0% |
| Venezuelans | 0.0 /100 | #298 | Tragic 13.0% |
| Immigrants | Jamaica | 0.0 /100 | #299 | Tragic 13.0% |
| Immigrants | Cabo Verde | 0.0 /100 | #300 | Tragic 13.1% |
Demographics Similar to Italians by Divorced or Separated
In terms of divorced or separated, the demographic groups most similar to Italians are Immigrants from Oceania (11.9%, a difference of 0.0%), Immigrants from Portugal (11.9%, a difference of 0.030%), Polish (11.9%, a difference of 0.040%), Immigrants from Grenada (11.9%, a difference of 0.070%), and Czech (11.9%, a difference of 0.070%).
| Demographics | Rating | Rank | Divorced or Separated |
| Immigrants | Morocco | 82.9 /100 | #141 | Excellent 11.9% |
| Immigrants | Zimbabwe | 81.5 /100 | #142 | Excellent 11.9% |
| Pakistanis | 81.3 /100 | #143 | Excellent 11.9% |
| Peruvians | 80.9 /100 | #144 | Excellent 11.9% |
| Croatians | 80.6 /100 | #145 | Excellent 11.9% |
| Immigrants | Grenada | 79.1 /100 | #146 | Good 11.9% |
| Poles | 78.6 /100 | #147 | Good 11.9% |
| Italians | 77.8 /100 | #148 | Good 11.9% |
| Immigrants | Oceania | 77.7 /100 | #149 | Good 11.9% |
| Immigrants | Portugal | 77.3 /100 | #150 | Good 11.9% |
| Czechs | 76.4 /100 | #151 | Good 11.9% |
| Immigrants | Hungary | 73.7 /100 | #152 | Good 11.9% |
| Austrians | 72.2 /100 | #153 | Good 12.0% |
| Chileans | 71.3 /100 | #154 | Good 12.0% |
| Japanese | 70.9 /100 | #155 | Good 12.0% |